


[NGW Magazine] LNG: Another record breaking year
The International Group of LNG Importers in April, and the International Gas Union last month, published annual reports on the LNG industry in 2017. Both make startling reading.
In his introduction, GIIGNL president Jean-Marie Dauger said that global LNG imports in 2017 recorded their highest annual growth rate since 2010, at 9.9%: they reached 289.8mn metric tons. Despite several delayed start-ups, new liquefaction capacity continued to come online in various areas of the world, ranging from the US to Australia, Malaysia and Russia, leading to a 26.2mn mt/yr increase in LNG supply compared with 2016.
The report confirms that expectations of an LNG surplus have not materialised, as, among other factors, rising imports into China contributed substantially to balancing the market.
Key conclusions are:
- Spot LNG prices followed a seasonal profile in 2017, although the increase towards the end of 2017 was stronger than a year earlier because of much higher than expected Chinese demand and colder than normal weather in northeast Asia.
- Contract LNG prices also rose as a consequence of higher oil prices.
- The main additions to LNG supply came from Australia and the US, where production from trains commissioned in 2016 continued to ramp up.
- Floating LNG Satu, the world’s first FLNG project, began producing in Malaysia during 2017.
- The contracting and pricing environment was still challenging for new supply developments – while two final investment decisions had been taken in 2016, only one project, Coral FLNG in Mozambique, was sanctioned last year.
- In terms of demand, the LNG market is becoming more diverse and more complex, with a total of 40 countries now importing LNG and 19 exporting (Figure 1).
- But despite competitive LNG prices and notwithstanding the development of FSRUs, Malta was the only new country that started receiving LNG last year.
- Most of the demand growth occurred in Asia, where LNG imports grew by 19.6mn mt, mainly owing to new energy policies in China.
- In general, demand by northeast Asian buyers experienced a strong rebound, something which was not evident at the beginning of the year.
- China overtook South Korea as the world’s second largest importer.
- LNG is now seen as a solution to reduce marine pollution.
Figure 1: Main LNG flows in 2017
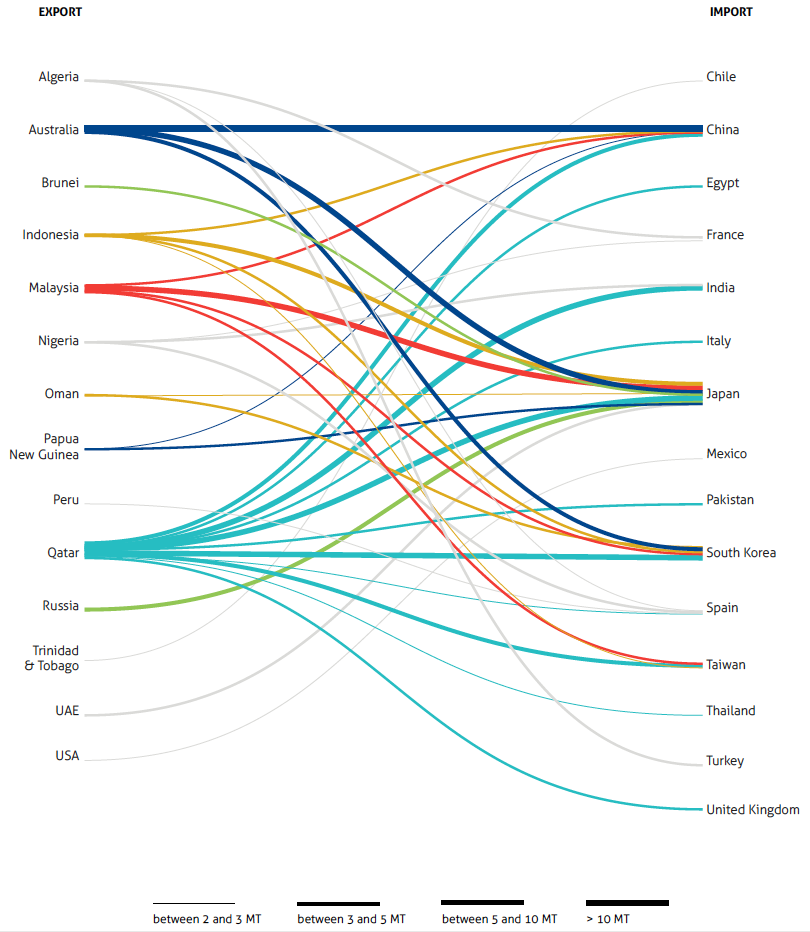
Credit: GIIGNL
GIIGNL confirmed that the LNG industry is experiencing accelerated change. Some firsts in 2017 included first FLNG online, first LNG bunkering vessels operating in Europe and first LNG exported from the Arctic region.
This change also includes new commercial instruments, implemented to adapt to the new realities of the markets as some traditional ones are being shelved although delivery ex ship still persists. As aggregators and traders take a greater share of the market, the break-up of the traditional value chain is gathering pace.
The future may be driven by US LNG exports. A significant supply build-up is on the horizon and this could further transform the LNG industry and bring on new evolutions, including a rise in market liquidity and flexibility.
However, the report warns that given the slow-down in final investment decisions (FIDs) during the last two years and the significant demand growth prospects, risks of a potential tightening of demand and supply in the medium term must not be underestimated.
Finally, a key conclusion from GIIGNL’s report is that cost reduction, without compromising safety and reliability, and meeting the changing requirements of buyers and consumers will be key for new projects to be developed.
Similar results are presented by the International Gas Union (IGU) in its 2018 World LNG Report released during the World Gas Conference (WGC) in June in Washington DC.
In his introduction David Carroll, chairman of IGU, says: “International trade in liquefied natural gas (LNG) continues to be one of the most vibrant segments of the world’s natural gas value chain… IGU continues its strong support of LNG as a means of addressing world energy needs and satisfying societal demands for cleaner energy, both in terms of human health afforded by lower emissions and meeting climate goals for reduced greenhouse gas emissions.”
The IGU says that, despite the price rebound towards the end of 2017-early 2018, the LNG market remains highly competitive. As a result, there has been considerable impetus for project sponsors to reduce costs, making reaching FID a challenge. This was made even more challenging by the long-term contracting environment that remained difficult in 2017.
Going further, the IGU states that global LNG prices are likely to trend downward along with the projected increase in supply. As a result, the use of LNG in power generation could increase, leading to higher LNG imports.
The importance of low prices was also highlighted by Fatih Birol, executive director of the International Energy Agency (IEA), when introducing Gas 2018 market outlook. He said: "While gas has a bright future, the industry is not without its challenges. These include the need for gas prices to remain affordable relative to other fuels in emerging markets and for industry to curb methane leaks along the value chain."
The key competition comes from the plunging costs of renewables and the persistent growth of coal use in Asia, particularly in China and India.
LNG supply and demand
New LNG production from Australia (10.7mn mt) and the US (9.7 mn mt) mean that LNG saw its strongest growth in 2017 since 2010 (Figure 2). Yamal LNG also came on stream in Russia and the first FLNG project, Satu, started production in Malaysia.
Figure 2: Growth in LNG exports in 2017
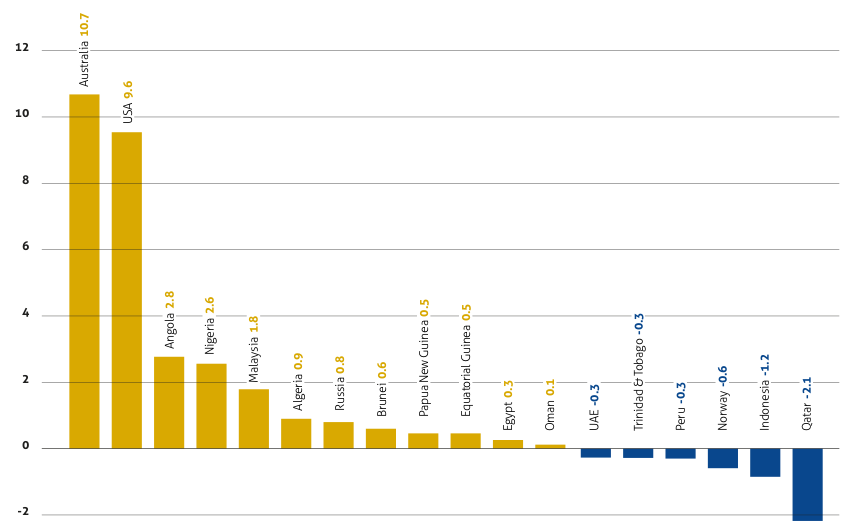
Credit: GIIGNL
Qatar continued to be the top supplier, with 77.5mn mt or 26.7% of global LNG, followed by Australia with 55.6mn mt or 19.2% (Figure 3). Qatar has already started the process to produce 30% more, reaching 100mn mt/yr.
Figure 3: LNG production in 2017
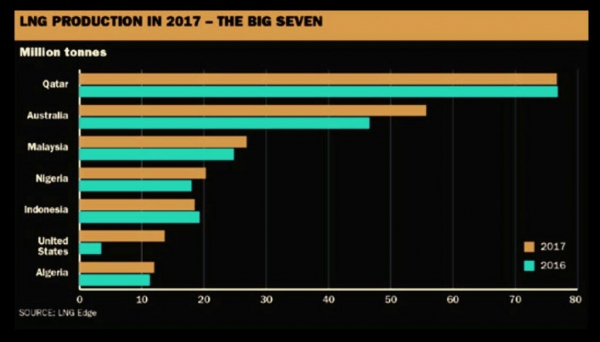
Credit: LNG Edge
This was confirmed at WGC by Saad Ai-Kaabi, Qatar Petroleum president, who said: “This will be a major milestone towards securing future LNG supplies to meet rising global demand.” He also pointed out that the glut of gas had not yet happened and last winter's demand had come as a surprise, including in Europe, where a lack of storage and some production problems pushed prices up; but he also said that countries needed investment in their infrastructure, such as to build floating regasification and storage units, in order to maximise their LNG demand.
US LNG exports reached almost all continents, with 40% to Asia, 34% to the Americas, 15% to Europe and 11% to the Middle East, reaching 25 countries compared with 13 in 2016. Demand in Asia was very strong, with LNG imports going up by 10.2% to 211.2mn mt, led by China with growth of 42.3% or 11.2mn mt.
India had only a small increase in imports, which were up by 1.2% (Figure 4). But Japan remained the largest importer with 83.5mn mt. Asia’s total share of global LNG demand was 72.9%.
Figure 4: Growth in LNG imports in 2017
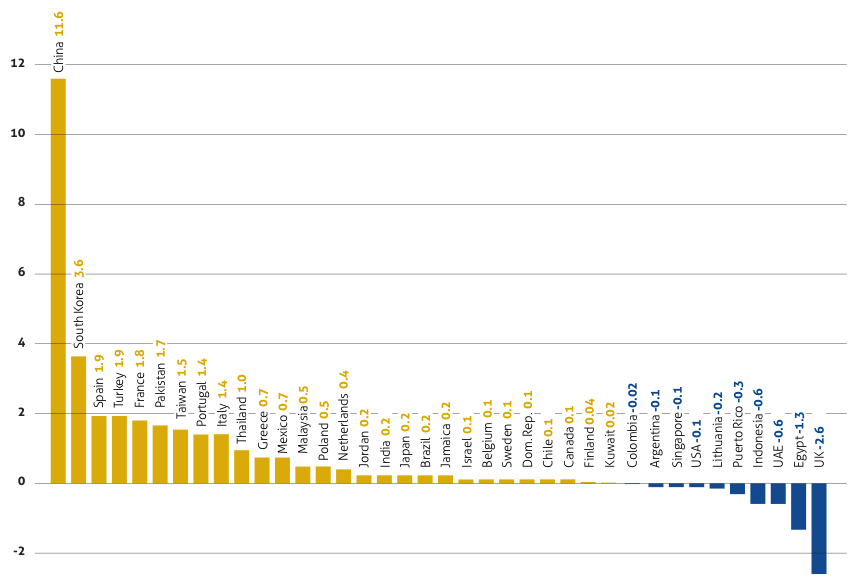
Credit: GIIGNL
Even Europe had a substantial net increase in LNG imports, by 19.5% or 7.5mn mt, mainly owing to the increase in demand for power generation. But Europe’s share of global LNG imports has actually fallen by nearly 50% since 2010, from 29.4% in 2010 to 15.9% in 2017, as gas demand has fallen and competition from cheaper pipeline imports has risen over this period.
There was an increase in LNG delivered on spot and short-term basis (4 years or less), up 2.7mn mt to 77.6mn mt, comprising 27% of the total (Figure 5). Of this, spot LNG imports (delivered less than three months from the transaction date) comprised about 20% of total volumes delivered in 2017. This was facilitated by the increased use of destination flexibility and increasing numbers of portfolio traders.
Figure 5: Share of spot and short-term LNG by region
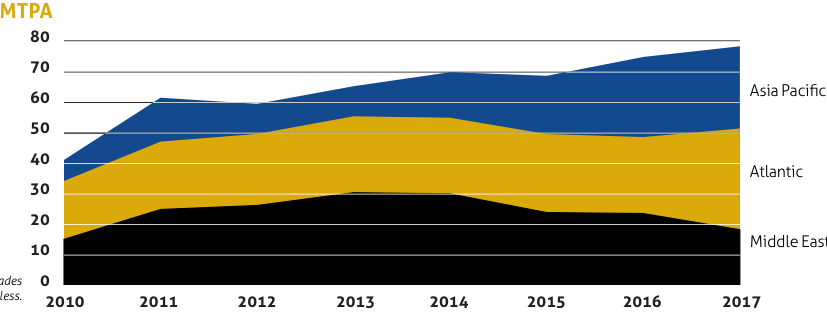
Credit: GIIGNL
The expected glut in LNG did not – yet again – materialise. In addition to China’s increased demand, actual LNG supplies in 2017 came on stream slower than originally planned, with actual supply more in line with original demand profiles.
However, as BP pointed out, the apparent absence of a glut also reflects the fact that the surplus LNG supplies which did emerge resulted in bouts of unsustainably low prices rather than a build-up of idle capacity. These low prices boosted demand.
Total global regasification capacity increased to 850mn mt/yr and total nameplate liquefaction capacity to 365mn mt/yr. A total of 28 FSRUs were in operation at the end of 2017, four more than in 2016, with a total capacity of 4.3mn m³. Another five are scheduled for delivery in 2018.
China’s impact
The single biggest factor driving demand last year was the surge in Chinese gas and LNG demand, up by over 15% and accounting for around a third of the global increase.
China accounted for almost half of the global expansion in LNG trade, overtaking South Korea to become the world’s second largest importer of LNG after Japan, with 39mn mt.
The increase in Chinese LNG imports in 2017 was the direct consequence of the Chinese government’s efforts in the residential, commercial and industrial sectors to restrict penetration of coal in order to reduce pollution in urban areas.
However, as BP points out in its Statistical Review of World Energy, even though Chinese gas demand looks set to continue to increase strongly in 2018, the factors that led to it are not likely to continue into 2019.
As a result, it seems unlikely that the extent of the surge in gas and LNG demand seen in China in 2017 will be repeated in 2019 and beyond.
This was confirmed in an interview published in NGW (Vol 3, Issue 10), in which JLC Network Technology confirmed that even though towards the end of last year China’s LNG imports experienced sharp growth, they were within the yearly expectations (figure 6).
Figure 6: China’s gas supply outlook to 2030
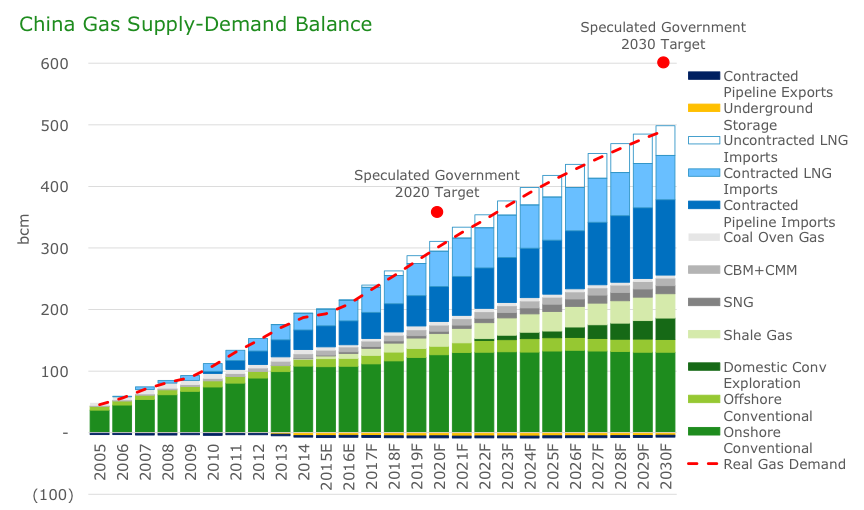
Source: SIA Energy (NGW Issue 12 Vol 2, 19 June 2017)
The problems happened because the coal-to-gas switching reached its maximum in the year, as a result of the government’s push to improve air quality and create better living environment for the people.
What was unexpected was the shorter-than-normal supply from domestic LNG plants in winter owing to various factors, including problems with infrastructure, which tightened the supply-demand balance. JLC does not see the shortage repeating in future years.
China will continue to improve its natural gas related infrastructure in 2018, including both storage and reception terminals, which is expected to ease gas supply problems. In addition, as a result of these gas problems and power shortages in some parts of the country, China’s National Development and Reform Commission (NDRC) has taken measures to increase thermal coal capacity in the medium to long-term to ensure stable supplies in the market. In addition to these measures, the NDRC also asked nuclear and hydropower generators to boost their utilisation rates.
Demand is expected to remain higher than a year ago for most of 2018, impacting prices, but should ease by 2019. Future LNG demand should carry on growing, but within expectations.
This is also confirmed by the IEA. In its Gas 2018 market outlook, it projects China to be importing 171bn m³ of natural gas, including LNG, by 2023. This is in line with China’s gas supply outlook to 2030.
The US shale gas factor
During the period from now to 2023, liquefaction projects will add about 104mn mt to global LNG capacity. The major contributor to this expansion will be the US with 62.5mn mt, followed by Australia, with 22mn mt and Russia with 11mn mt. With the coming of what it calls the 'Shale Gale', IHS Markit expects US shale gas production to carry on increasing, feeding LNG exports (Figure 7).
Figure 7: US natural gas – from imports to exports
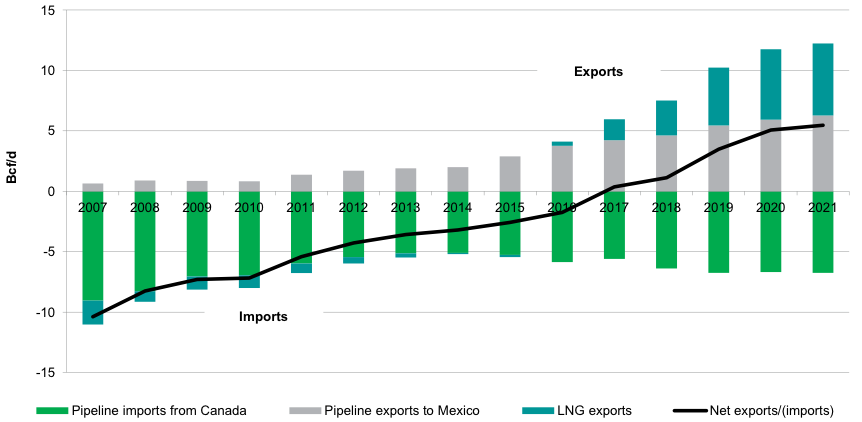
Source: IHS Markit
In IHS Markit’s current view, as of 2018 there are about 1,250 trillion ft³ (about 35 trillion m³) of shale gas resource that is economic below $4/mn Btu (Figure 8). This is about the same as the total proved reserves of Russia.
Figure 8: US shale gas cost curve
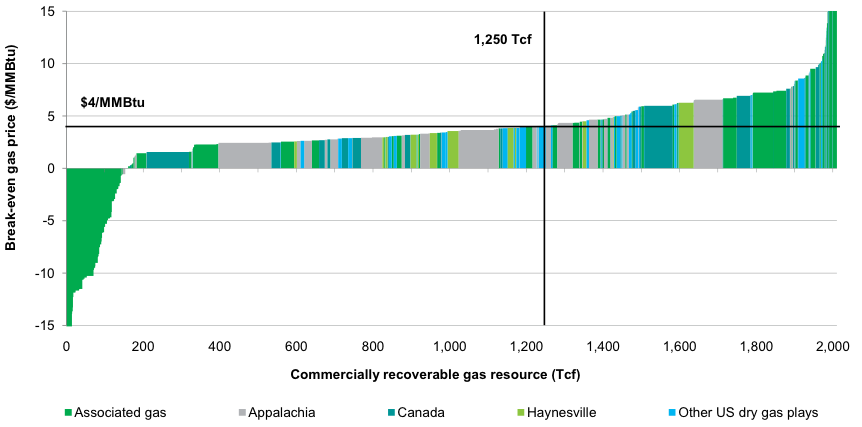
Source: IHS Markit
What is remarkable about Figure 8 is that out of this resource, close to 160 trillion ft³ – substantially more than the total combined proved reserves of the eastern Mediterranean – can be produced at negative costs, at an average of -$6/mn Btu. This is associated gas, where production costs are recovered from crude oil. But the urgency comes from the fact that this crude oil cannot be produced without securing markets to dispose of the gas – it cannot be flared.
This is leading to more low-cost US gas production. Between 2007 and 2017, US natural gas production grew from 535bn m³/yr to 750bn m³/yr, and it is projected to rise to 950bn m³/yr by 2025.
Overall, the unconventional oil and gas revolution has been altering the outlook for US natural gas dramatically over the past decade. It has also contributed to a massive reduction in US carbon emissions from power generation, by about 30% from 2005 to 2017.
Given that the North American gas market is reaching saturation point, with supply exceeding domestic demand, there is increasing pressure to export more of this gas as LNG. Over the next five years US LNG exports will grow from 14.5mn mt/yr in 2017 to 77mn mt/yr.
This increasing, low cost, gas production will also be feeding the second wave of US LNG exports expected to be unleashed on the world in the coming decade.
US LNG, benefiting from this low-cost shale gas resource, has the potential to impact global gas markets in a similar manner to the way shale oil has been impacting global oil markets and prices.
According to IGU, so far 336mn mt/yr new capacity has been proposed as part of this next wave, with many projects intended to come online in the early to mid-2020s when some companies foresee a tighter market.
IHS Markit concludes: “The Shale Gale and its consequent impact on oil have brought a new element of influence and independence for the US. LNG and oil exports are becoming a significant and positive factor in the relations with many countries and a key element in discussions about trade.”
Charles Ellinas