


[NGW Magazine] Gas pricing trends stabilise
The world's gas trade is moving more slowly to competitive pricing, but now that it accounts for almost half the total, the rate of change is slowing, while the decline in oil indexation has also slowed.
The share of world's gas market that is priced off hubs and indices rose again between 2016 and 2017, reaching 46%, according to an International Gas Union (IGU) report launched at last month's World Gas Conference. This compares with 45% in 2016.
‘Gas on gas competition’ retains the largest share of the world gas market, according to the report entitled Wholesale Gas Price Survey 2017 Edition, ahead of oil indexation which lost a 0.5% percentage point share year-on-year, ending at 19.5%.
During the 2005 to 2017 period, the share of gas on gas competition rose by almost 15 percentage points, while oil price escalation has declined by 5 percentage points. As such, this tenth annual IGU price survey shows a slowdown in both main pricing trends.
Figure 1: Wholesale Price Levels 2005 to 2017 by Region
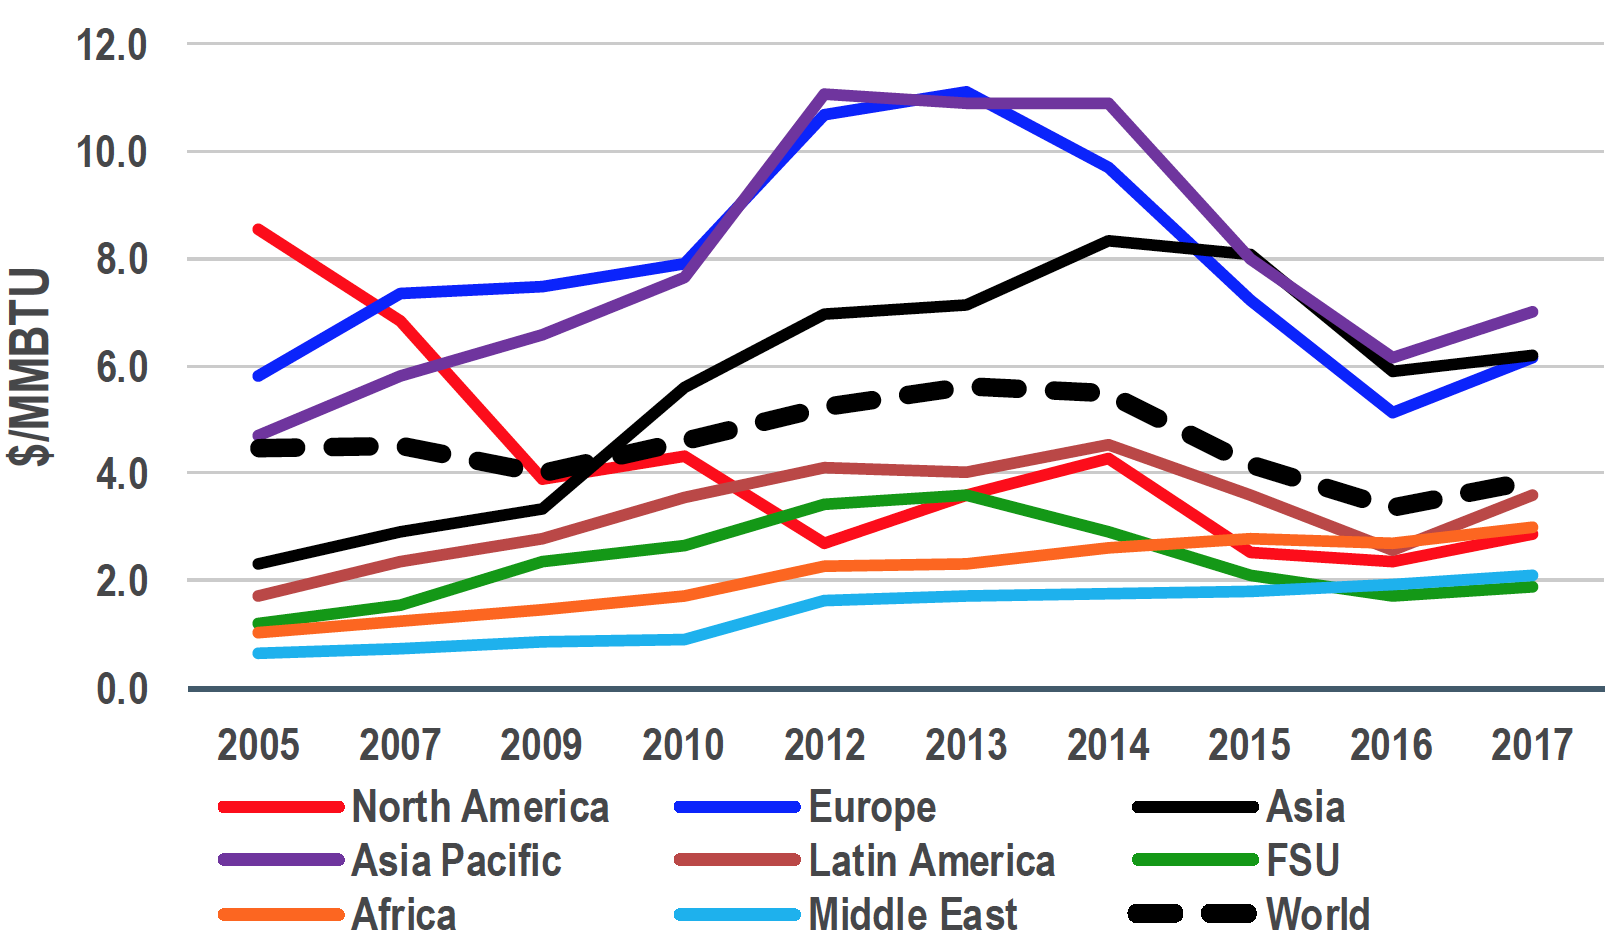
Credit: IGU Wholesale Gas Price Survey
Out of total world consumption of 3,740bn m³ in 2017, gas on gas pricing’s market share of 46% amounted to over 1,700bn m³, dominated by North America (950bn m³), followed by Europe at 380bn m³ and the former Soviet Union (FSU) at around 190bn m³. In all, gas on gas competition can now be found in 54 countries, in one form or another, and in all regions of the world.
Gas-on-gas pricing made strong gains in the FSRU as Ukraine imported hub-priced gas from western Europe; and also in China, on the back of LNG imports there and also of negotiated sales of domestically-produced gas to large users there. In all, gas on gas competition can now be found in 54 countries in all regions of the world, said the IGU.
But the IGU survey found that oil price indexation (or escalation) for gas accounted for 730bn m³ of sales, predominantly in the Asia Pacific (270bn m³), Asia (230bn m³) and Europe (155bn m³) regions – and in some 59 countries, and across the world - except in North America.
“The continued decline in Europe [was] partially offset by an increase in Asia Pacific, as Malaysia and Indonesia moved to more oil price escalation in domestic pricing,” the IGU survey remarked. This appears to bear out a report earlier in the year by brokerage Poten & Partners that found a “move toward Brent” oil indexation in the pricing for some shorter Asia-Pacific LNG term contracts.
The IGU survey found that intra-FSU gas trade switched from ‘bilateral monopoly pricing’ (BIM) in 2009 towards oil-indexation, as have more recently imports of pipeline gas from Turkmenistan to China, with one of Russia-to-Turkey gas contracts changing from BIM to oil-indexation. It also said that the Qatar-to-India contract, originally in the BIM category, is now oil-indexed.
The IGU report’s three regulated pricing categories – regulated cost of service, social/political price regulation, and regulation at below-cost – accounted in total for 30%, or 1,130bn m³ sales. The regulated cost of service model was found in 17 countries, mainly Russia, China and the Asia-Pacific.
Regulation based on social and political factors was found in 23 mostly Middle East countries, led by Iran, Saudi Arabia, Oman and the UAE. Price regulation at below cost clung on in 13 countries (among them, Kazakhstan, Turkmenistan and Uzbekistan; Egypt and Algeria; and Venezuela).
In Russia, the IGU notes that pricing and policy changes not only saw a switch towards gas on gas competition, but also a switch from the subsidised ‘regulation below cost’ of 2009 to ‘regulated cost of service’ as Gazprom finally stopped losing money on its domestic gas sales. However, it judges that, in 2014, a freeze on some prices meant a partial switch back to ‘social/political regulation’.
European gas-indexation depends on which region
In Europe, gas on gas competition has increased from just 15% in 2005 to 70% in 2017, while oil-indexation has declined from 78% to 28% over the same period (Figure 2). Thus gas-indexation is now dominant in many EU countries. Where not yet dominant, “renegotiations have seen the introduction of hybrid pricing formulas where oil-indexation is partly maintained but within a price corridor set by hub prices,” the report said.
Eni is understood by NGW to have contracts into Italy, with Russian piped gas export monopoly Gazprom and its Algerian counterpart Sonatrach, that have elements of such hybrid pricing.
The IGU found that gas-on-gas pricing is now dominant, at 92%, in northwest Europe, though less so at 73% in central Europe (Austria, Czech Republic, Hungary, Poland, Slovakia, Switzerland), but only 39% in southern Europe (Greece, Italy, Portugal, Spain, Turkey). In southern Europe, oil-indexation has declined from 100% in 2005 to around 61% in 2017 – still a high share for Europe. In the Balkans (excluding Greece) there is only 11% gas on gas competition – with recent increases in Croatia.
Figure 2: Regional Price Formation 2017
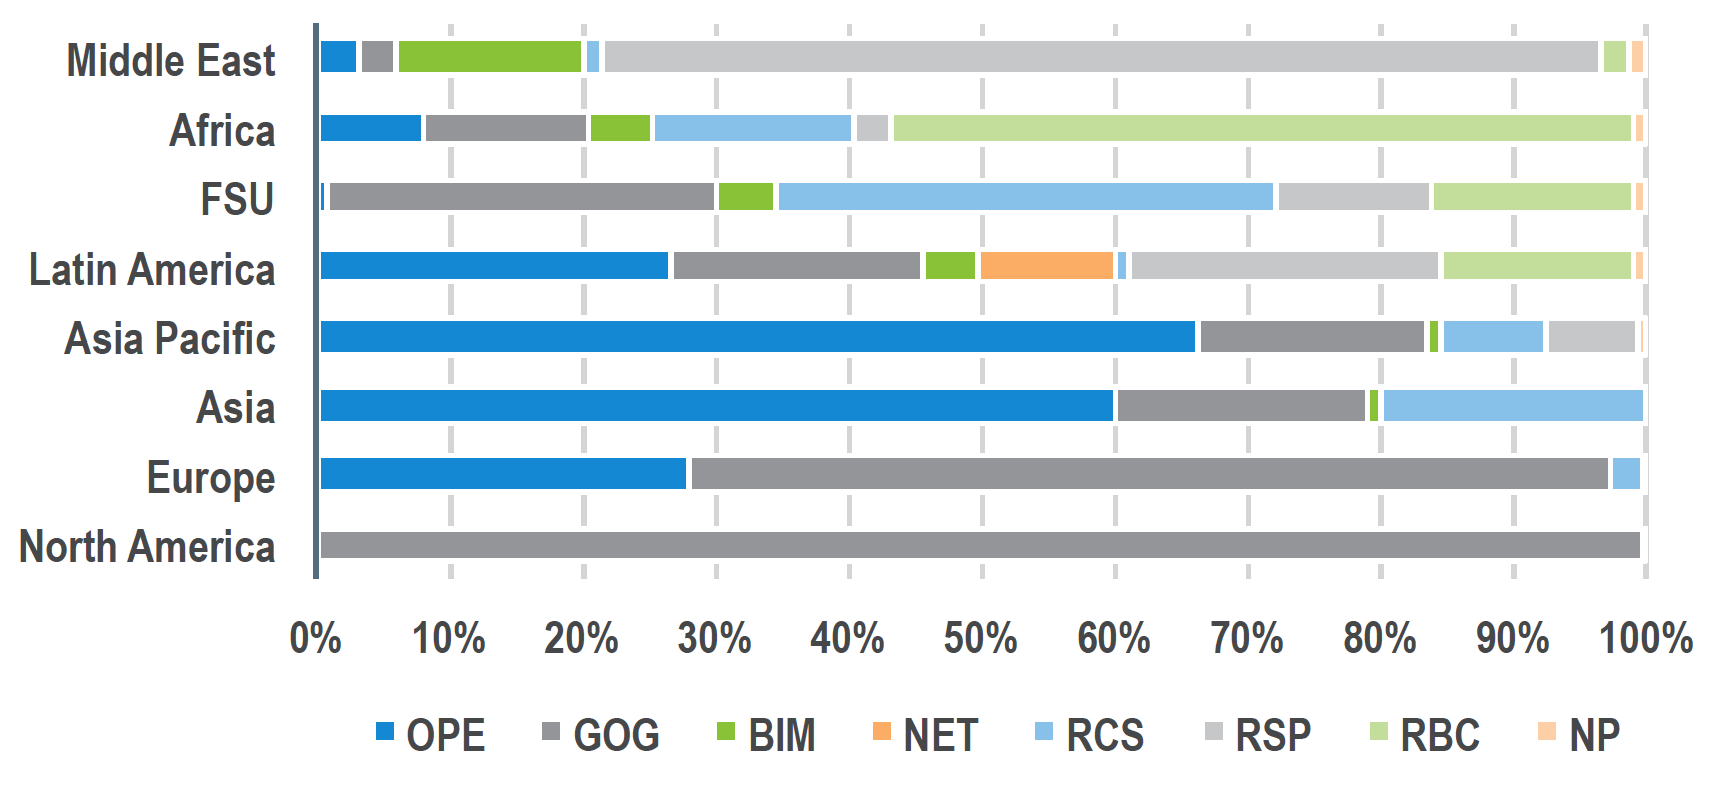
Credit: IGU Wholesale Gas Price Survey
Pricing of piped vs LNG imports
Of the world’s piped gas imports in 2017, namely 675bn m³, the IGU report found that gas-on-gas pricing accounted for 61% of the total – at some 411bn m³ – of which Europe 273bn m³, North America 128bn m³, and the FSU 10bn m³ (the latter all imported from western Europe).
Oil-indexation represented 31% or 212bn m³ of piped imports (half into Europe mainly to Turkey, Italy, Spain and Germany, the other half spread among China, southeast Asia, and Brazil/Argentina). BIM accounted for the 8% balance, with that 52bn m³ chiefly in two trade flows: Russia-to-Belarus and Qatar-to-UAE.
In contrast, global LNG imports of 390bn m³ in 2017 were 72% oil-indexed and just 28% gas-indexed. Asia-Pacific and southern Europe dominated the former, imports to North America and northwest Europe the latter. Spot LNG sales were predominantly in the gas-indexed category.
Greater price convergence
Global gas prices have been converging over the period since 2005 (Figure 1). This goes against conventional wisdom of global gas price divergence, based on a few regional gas price markers such as Henry Hub, NBP and Japanese import prices. IGU says that analysis, using the price survey data, shows that global gas prices have been converging continuously since 2005, indicating further globalisation of the gas markets.
The IGU further finds that there is more gas price convergence amongst countries with market related pricing; or have connected with the global gas market through gas imports; or with oil-indexed gas prices; and within Europe.
The study says it will be interesting to see if the ramp-up of US shale LNG exports in the coming years affects the current situation where North America “has become effectively disconnected from the global gas market.”
To read the Wholesale Gas Price Survey 2017 Edition in full, go to https://www.igu.org/events/wgc-2018 and click the relevant ‘Download’ link
Mark Smedley