

Offshore Gas, Wind Draw Capex
The amount of energy produced offshore is set to grow out to 2040, with gas and wind-power to benefit more as oil goes into decline, according to a new IEA report that considers two scenarios for future energy policies.
The International Energy Agency's Offshore Energy Outlook (OEO), published in early May, as a coda to its 2017 World Energy Outlook (WEO) published six months ago, sees the fortunes of oil, gas and wind-power varying depending on the policies in place. But it is all to the benefit of the offshore supply and services industry.
|
Advertisement: The National Gas Company of Trinidad and Tobago Limited (NGC) NGC’s HSSE strategy is reflective and supportive of the organisational vision to become a leader in the global energy business. |
It warns that the need for offshore energy is also good reason for regulators to pay close attention to the operational and environmental performance of this sector.
In the OEO’s New Policies Scenario (NPS), based on existing policy frameworks and announced intentions, offshore oil production edges higher, while gas surges ahead to become – in energy-equivalent terms – the largest component of offshore output. Generation from offshore wind rises by more than ten times to 2040, helped by supportive policies in Europe, China and elsewhere.
Its alternative Sustainable Development Scenario (SDS) sees the world get on track to attain its climate, air quality and energy access goals. Under SDS, the balance of offshore activity shifts, but the overall level remains substantial. By the 2030s, offshore investment in this scenario – currently heavily weighted towards oil – is split into three roughly equal parts as oil and (to a lesser extent) gas output growth is lower than in its main scenario. Offshore electricity generation however grows twice as fast and provides 4% of global power generation by 2040.
Worldwide natural gas use rises much more strongly under the NPS scenario: by 45% in the period to 2040. Under SDS, gas demand still rises by over 15% to 2030, remaining broadly at that level until 2040. But it still overtakes coal in the mid-2020s and oil in the mid-2030s to become the largest single fuel in the global energy mix.
The SDS requires $4.6 trillion in capital investment in all types of offshore energy over the period to 2040, whereas NPS takes $5.9 trillion over the same period.
That translates into almost $200bn/yr of capex between 2017 and 2030, and $250bn/yr in 2031-40, under its NPS scenario – but much less under SDS: roughly $150bn/yr and $120bn/yr respectively.
Costs lower but technology better
The report notes that big projects offshore Norway and in the US Gulf of Mexico that once needed a breakeven oil price of $60-$80/b are now claimed to be robust at $25-$40/barrel. “Breakevens are about 40%-50% lower than where they were in 2014,” co-author Tim Gould, the head of the WEO Energy Supply Outlook Division said.
Today, 28% of the world’s gas supply is produced offshore, notes Gould, chiefly in shallow water.
In its NPS scenario, the report forecasts a 700bn m³/yr rise in offshore gas production to 2040, split equally between shallow and deepwater developments, taking the offshore share of total gas production above 30% by 2040. Brazil, Australia and the eastern Mediterranean will contribute to this increased offshore gas production, the report forecasts, but most growth will be in the Middle East. This is mainly due to the continued development of the world’s largest gas field, Iran’s South Pars/Qatar’s North Field. Africa also sees more action, notably in the development of the huge gas finds off Tanzania and Mozambique.
Liquefaction projects used to be all onshore, said Gould, but now they are increasingly offshore. Mozambique’s first such project will be the Coral South floating LNG (FLNG) venture: it was the world’s only LNG export venture to take final investment decision (FID) in 2017 and is eying 2022 start-up. Now BP aims to take FID on Tortue FLNG (west Africa) late 2018 for first gas in late 2021.
Prospects for offshore gas remain relatively robust in the SDS scenario, but a decline in oil demand in this scenario weighs against new capital-intensive offshore oil projects.
Two scenarios
Under its NPS scenario, offshore natural gas production rises to almost 1700bn m³ in 2040, or just over 30% of total gas production. Shallow water gas production increases from 950bn m³ in 2016 to 1,250bn m³ in 2040, while deepwater more than quadruples from under 100bn m³ in 2016 to over 450bn m³ in 2040.
Middle East offshore gas is forecast to rise from 330bn m³ in 2016 to 570bn m³ by 2040, while Brazil deepwater pre-salt gas will triple to 60bn m³ in 2040 and Australia’s doubles to 130bn m³. Norway offshore gas though will decline from a 120bn m³ peak in 2020 to 100bn m³/yr around 2040.
Offshore oil production rises only slightly from its current 27mn b/d under NPS, with Brazil, Mexico and the US Gulf being the leading contributors to future deepwater supply.
Under its SDS (Sustainable Development Scenario), offshore electricity production is the big winner, as global installed offshore wind capacity rises above 350 GW in 2040, more than double its NPS level, with generation also increasing to 1,200 TWh. Marine (or tidal) power also tops 30 GW by 2040 and produces 85 TWh of electricity. By 2040, offshore electricity generation meets 3.5% of the world’s power generation needs – almost 12 times its current share.
Under SDS, offshore natural gas production also grows, albeit less rapidly than under NPS, to 1,380bn m³ in 2040, one-third of global gas production at that time, whereas offshore oil production declines to 20mn b/d by 2040 as shallow water oil shrinks while deepwater output stays constant.
Still under SDS, offshore gas production rises to 420bn m³ in the Middle East by 2040 (versus 570 bn m³ under NPS), to 110bn m³ in Eurasia (versus 170bn m³ in NPS), and 160bn m³ in Africa (compared with 230bn m³ in NPS). “The downside for European offshore gas production in the Sustainable Development Scenario is limited, as it benefits from existing infrastructure, market proximity, and an assumption that Europe develops indigenous resources if possible” – rather than more imports.
Offshore spend
Investment patterns broadly correlate with the overall outlook for production. Under NPS, one of the key locations for petroleum investment is Brazil, where capex is forecast to reach $60bn/yr by 2040, over four fifths of which is for oil. Combined capex in the US/Mexican sides of the Gulf is forecast to reach $20bn/yr by the mid-2020s and exceed $30bn by 2040. Offshore Africa, capex is expected to pick up after 2025 thanks to “some rebound in Nigeria and Angola and to the major gas projects coming online in east Africa.”
In SDS, oil and gas activity and investment are lower, especially post-2030, and the outlook diverges markedly from the NPS scenario. Thus, investment in gas under SDS is relatively robust, but all oil capex tails off in the 2030s, with North Sea capex falling below $5bn/yr by 2040.
Average annual offshore oil and gas upstream investment by region and scenario
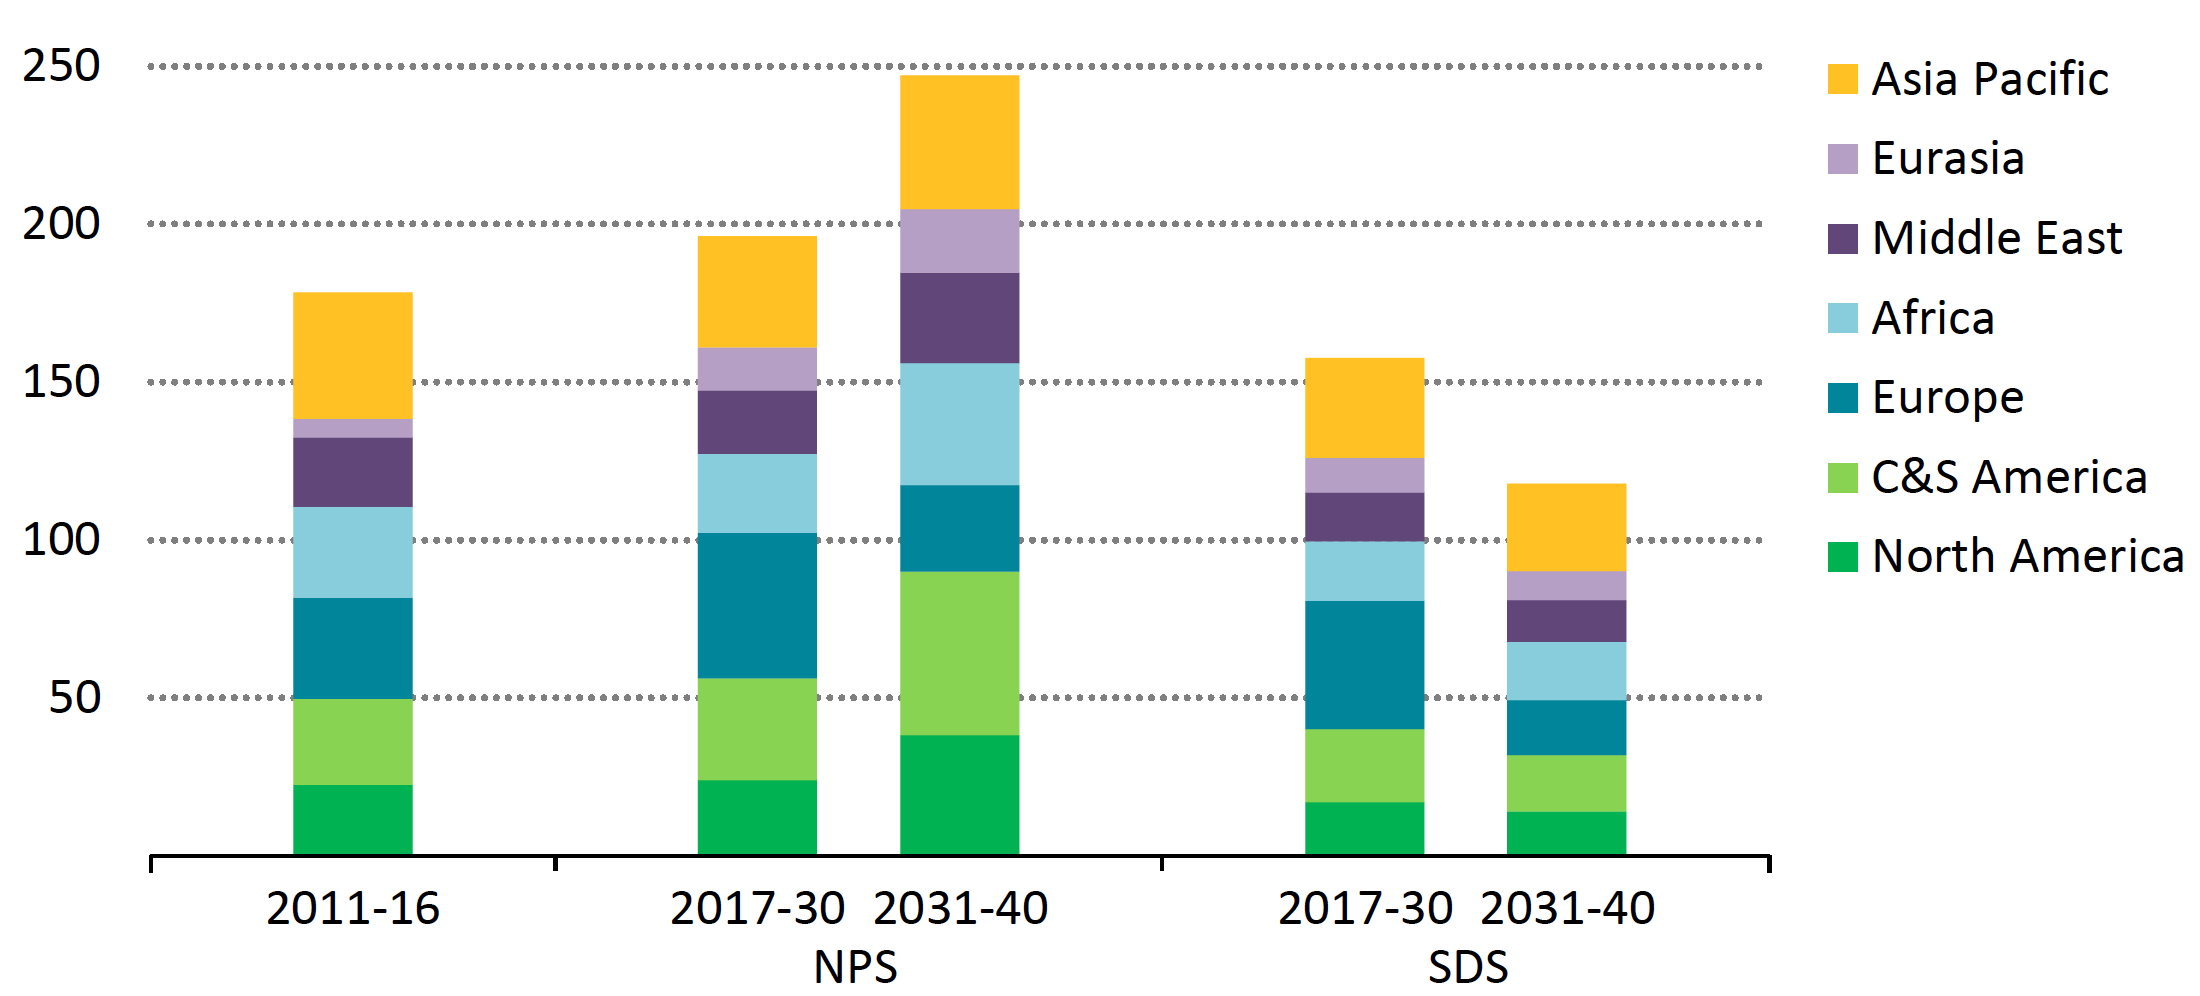
Graphic courtesy of the IEA’s May 2018 Offshore Energy Outlook report
The report argues that “integrated thinking” could reap benefits all round, by:
- Electrifying offshore oil and gas platforms, something Statoil/Equinor already pioneers;
- Factoring in that an estimated one-third of the full lifetime costs of an offshore wind project may have significant synergies with the oil and gas supply chain; and
- Re-using offshore oil and gas infrastructure once it reaches the end of its operational life. Thus, platforms could become offshore bases for maintaining wind farms, units to convert power to hydrogen, or be used to inject CO2 into depleted fields. The North Sea is also likely to be the laboratory that technically and commercially tests such synergies.
Policy support and technology advances are also favouring offshore wind whose turbines are now becoming giants, the report adds: “The height of commercially available turbines has increased from just over 100 metres capable of producing 3 MW in 2010, to 200 m high and 8 MW in 2016, and a 12-MW turbine design now under development is 260 m high.“
Installations are also moving further from shore, tapping better quality wind resources and pushing up capacity factors. The IEA says that some offshore wind projects scheduled to enter into operation in the early 2020s did not require any price guarantees from bill-payers or governments, although they often depend on transmission grids to shore being developed by third-parties and subsidised. However, offshore wind capacity at 18.7 GW in 2017 contributed 56 TWh, just 0.3% of global electricity generation.
For offshore wind investment, a cumulative $530bn of capex is required from 2017 to 2040 under the NPS (averaging $22bn/yr), but that cumulative figure almost doubles to just below $1 trillion in the SDS. Europe will be the largest market under both scenarios at $330bn; China follows at $110bn under NPS but $260bn under SPS.
Decomm challenge
Decommissioning platforms will become a bigger and bigger business out to 2040, with between 2,500 and 3,000 offshore projects likely to be on the list. This will intensify the debate over costs and optimal approaches. Today the industry decommissions around 120 structures per year, mostly in North America. The North Sea will provide a good example of the challenges and costs debate, as it has over 500 platforms.
Gould spoke of a “wall of decommissioning activity” on the horizon. Mostly steel structures have been decommissioned to date, but more complex structures in deeper water will need scrapping later. “Some structures could be potentially be re-used,” he said, pointing to synergies with offshore wind.
Arctic outlook
Gould told NGW that the IEA’s NPS (New Policies Scenario) does not foresee significant new oil and gas investments in offshore Arctic to 2040, beyond what has already been sanctioned, as “by and large there are other onshore and offshore opportunities that appear more attractive.”
In addition, there is limited appetite now for complex long-lead time projects, the partial exceptions being in Norway (Johan Castberg will come online mid-2020s) where further development and infrastructure is possible in the Barents Sea, and also in Russia.
“For the future, we wouldn't rule out further developments in Russia, especially given the strategic desire to get Arctic investment moving: however, sanctions and lower prices and the indications that most of the undiscovered might be gas, mean that our projections are very cautious for the moment,” adds Gould.
The IEA’s May 2018 Offshore Energy Outlook report can be downloaded here. This year’s IEA World Energy Outlook (WEO 2018) is due for release on November 13 2018.
Offshore Gas Looms Large in 2018
Gas features prominently among the 100 new offshore projects that Rystad Energy forecasts will be cleared for development in 2018.
Firm oil prices will likely mean 100 new offshore projects cleared for development in 2018, said research consultancy Rystad Energy in early May. That contrasts with only 60 projects in 2017 and fewer than 40 in 2016.
The 100 projects add up to $100bn of capital investment, said Rystad's latest Oilfield Service Report. Average investment per offshore project though is about $1bn, against $1.8bn for those approved in 2013. Several of the 100 this year are offshore gas projects.
Rystad shows an average reduction of close to 30% in 2018 compared to 2014, the main driver for which is the large 50-70% drop in day rates by offshore drilling contractors. Engineering procurement construction and installation (EPCI) costs for surface platforms and subsea infrastructure are down also by 20-30%.
The time required to drill and complete a well has fallen by 30% in the North Sea, Gulf of Mexico and Brazil over the past four years, said Audun Martinsen, Rystad vice president of oilfield services research.
The research firm sees about 30 of the project approvals coming through this year in Asia including Pegaga in Malaysia and the latest D6 phase in India (both gas), plus 30 in Europe including Neptun Deep gasfield (Romania) and the UK Penguins oil/gas re-development. Of the four named, all but Neptun have taken final investment decision.
Africa should see green lights for nearly 20 projects, with a similar number forecast in the Americas.
“E&P companies have more free cash flow at hand in 2018 than they did during the recent peak years of 2008 and 2011. In fact, 60% of the companies looking to finance their project development costs can do so through their cash flow. Supported by strong oil prices, we see a very small risk of these projects not materialising,” added Martinsen.
The average breakeven price for deepwater developments currently stands at about $45/b, and for shallow water it is close to $30/b, said Rystad, adding also that payback times have fallen by three years for deepwater projects and by 1.5 years for shallow water schemes since 2014. “Offshore projects can now compete with some of the best acreages in the Permian basin in terms of breakeven prices. With rising inflation in the US shale, offshore appears geared to out-compete shale this year and next,” concluded Martinsen.