


Global energy and carbon emissions [NGW Magazine]
The International Energy Agency (IEA) released its annual ‘Global Energy & CO2 Emissions Report’ (GECO 2019) March 26 and it makes good reading for natural gas but raises concerns with regards to carbon emissions in 2018. These sharply to 33.1 gigatons (Gt) (Figure 1). Coal contributed over 30% to this.
The report states: “Global energy consumption in 2018 increased at nearly twice the average rate of growth since 2010, driven by a robust global economy. Demand for all fuels increased, led by natural gas, even as solar and wind posted double digit growth. As a result of higher energy consumption, CO2 emissions rose 1.7% last year and hit a new record.”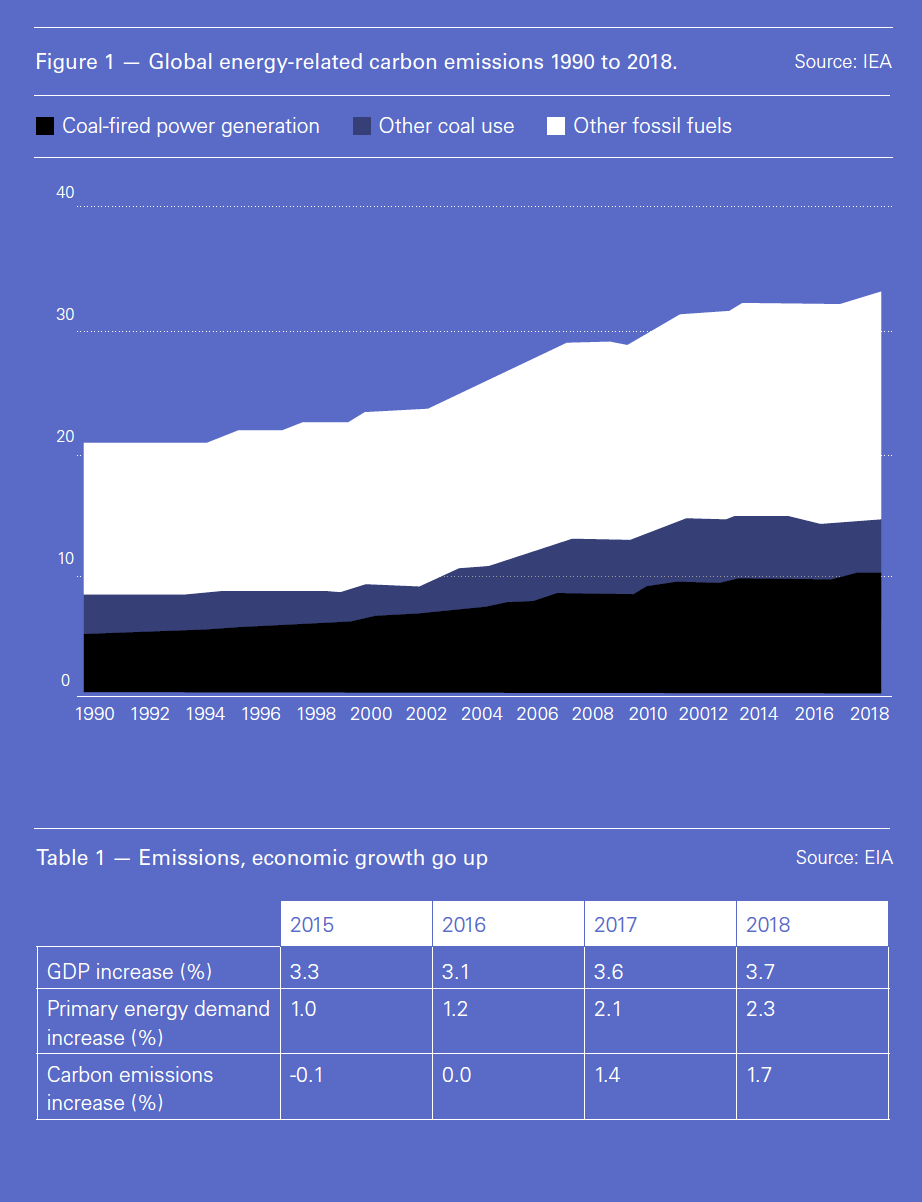
Global GDP increased by 3.7% in 2018, primary energy use grew by 2.3% – the fastest so far this decade – and CO2 emissions by 1.7%. These numbers contradict the optimistic view that global economic growth, global energy consumption and carbon emissions are becoming decoupled.
The year 2015 was hailed as historic because global and major country emissions showed clear signs of falling while global GDP was increasing and there was a very small reduction in global carbon emissions. A repeat in 2016 gave rise to the hope that the world was getting into grips with carbon emissions. But results since then put paid to this view (Table 1).
The biggest contribution to the emissions growth in 2018 was from the US, where they rose 3.1%; China, 2.5%; and India, 4.5%. Europe managed to reduce its emissions by 1.3%, with the UK achieving a 2.4% drop – taking it back to 1880 levels – and Japan's fell for the fifth year running as more of its nuclear reactors came back on line.
Robust global economic growth over the last two years has led to higher energy demand (Figure 2) resulting from robust global economic growth during the last two years. Even though global renewable energy has been growing by an average 8.3%/yr over this period, it was not sufficient to keep up with the increase in global electricity demand.
Nevertheless, as a result of the growth in low-carbon energy sources in 2018, emissions growth was substantially reduced – without it emissions would have been 50% higher.
Energy efficiency was also an important contributor to averting emissions growth in 2018, but its contribution was around 40% lower than in 2017, largely because of a continued slowdown in implementing energy efficiency policies. 2018 saw the lowest rate of improvement since 2015. In fact energy efficiency gains, at 1.3%, were only half the average improvement rate for 2014-2017.
The IEA states: “Economic growth, particularly in emerging economies, will continue to put upward pressure on energy demand and emissions… governments need to scale up the use of all policy tools at their disposal,” to unlock energy efficiency potential.
Without this, the acceleration required in the IEA ‘Sustainable Development Scenario’ – to meet the Paris Agreement goals – will not happen.
Much of the challenge lies within Asia, where high economic growth is fuelling the rising energy demand, which in turn leads to higher emissions. But pointing the finger at Asia is not the answer. First, energy security, driven by trade wars and sanctions concerns – dealt with separately in this edition of NGW – is contributing to the way energy demand is being met. In Asian countries, and particularly China, but also India and Japan, these concerns are leading to policies and measures to minimise energy imports, favouring domestic sources of energy such as coal, renewables and nuclear.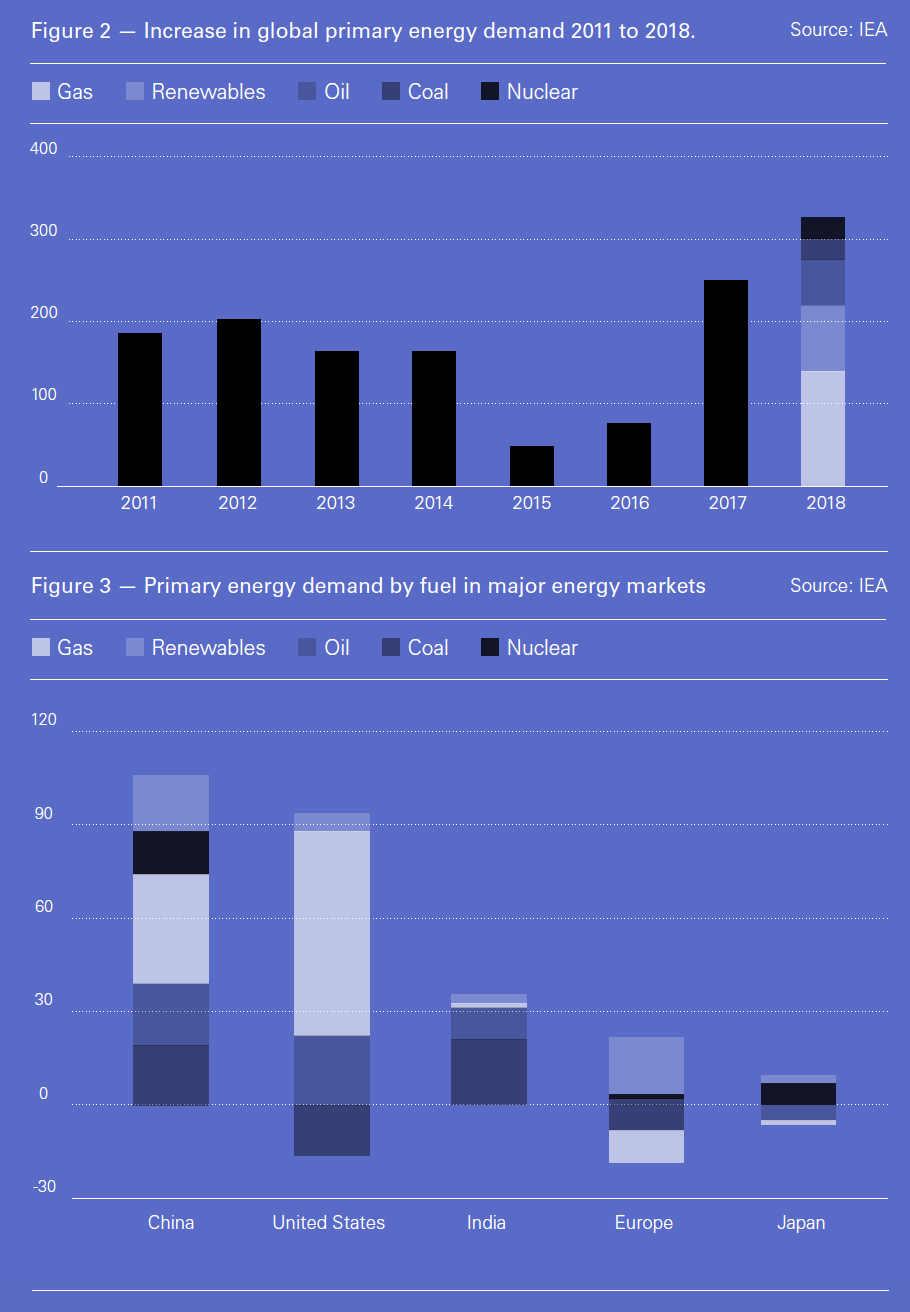
As a result, the energy focus has turned to domestic energy and security of supplies, inevitably with less concern about international pressure regarding environmental policies. The priority is on ensuring continuing economic growth and continuing use of all energy fuels, including coal – which contributes to the rise in carbon emissions – while maintaining efforts to clean up air pollution in cities.
Second, a Paris Agreement commitment by developed countries in 2015 to provide $100bn/year until at least 2025 to help developing countries tackle climate change was not and is nowhere being achieved. This has not helped advance the implementation of the agreement. In November last year India, China, Brazil and South Africa said in a joint statement: “Finance is one of the critical enablers of climate actions in developing countries.”
Unless these concerns are addressed by the developed countries, these problems may persist for a long time.
Energy demand
Robust economic growth led to a 2.3% increase in global primary energy demand, with natural gas, oil and coal providing 70% of it, for the second year running. China, the US and India together accounted for nearly 70% of this rise (Figure 3).
Global electricity demand continued growing rapidly, up by 4% in 2018, to the extent it met a fifth of total energy demand. But with 64% of electricity still coming fossil fuels (Table 2), electrification does not necessarily mean cleaner energy or lower emissions. Despite substantial growth, solar and wind power provided only 7% of the electricity mix in 2018 and the power sector accounted for almost two-thirds of the growth in carbon emissions.
Last year also saw more plans to develop carbon capture and storage at large scale, with the number of projects in operation, under construction, or serious consideration increasing to 43.
IEA executive director Fatih Birol said: “Despite major growth in renewables, global emissions are still rising, demonstrating once again that more urgent action is needed on all fronts – developing all clean energy solutions, curbing emissions, improving efficiency and spurring investments and innovation, including in carbon capture, utilisation and storage.”
Nuclear generation met 7% of the increase in global energy, with most of it resulting from new capacity in China and the restart of four reactors in Japan. It also provided 10% of the electricity mix in 2018 – returning to pre-Fukushima levels - and helped avert nearly 60mn mt of carbon emissions.
Global oil demand rose by 1.3% in 2018, led by strong growth in the US, China and India, but it was slightly lower than the increase in 2017. This was led by an increase in large petrochemical projects, partly offsetting a slowdown in growth in petrol demand.
The US had a few surprises, largely driven by extreme weather conditions and switching from coal to gas. First, and worryingly, after three years of carbon emission reductions, there was a substantial increase of 150mn mt of CO2, or 3.1%, in 2018, despite a significant switch from coal-to-gas.
Second, there was an unprecedented increase in natural gas demand, up by 80bn m3 or 10.5% in comparison to 2017. Increases over the five previous years averaged about 1%. But that 2018 rise in US demand includes gas that was liquefied and exported, and so some of the 80bn m3 would have displaced dirtier coal.
Natural gas
The biggest energy gains in 2018 came from natural gas, up 4.6%, or 170bn m3 in comparison to 2017. It emerged as the fuel of choice in 2018, accounting for nearly 45% of the increase in total energy demand. With a 23% contribution (Table 2), it remains the second largest source of electricity generation.
Birol said: "Last year can also be considered another golden year for gas, which accounted for almost half the growth in global energy demand.”
Most growth in gas demand was in the US followed by China (Figure 3). Together, they accounted for about 70% of the total.
The US gas demand increase was the highest since early 1950s and equals the UK's total gas demand.
In China natural gas demand increased by almost 18%, or 42bn m3, the fastest growth rate since 2016, making China the largest gas importer in the world, ahead of Japan. Gas now accounts for 8% of primary demand in China, double its share at the start of the decade. But a slowdown in China’s economic growth and energy security concerns are bringing demand growth for gas imports nearer the 10% range in 2019.
Natural gas demand declined in Europe in 2018 after two years of growth. This is partly due to milder weather, but possibly also due to the rapid increase in renewables which led to a reduction in the use of gas in power generation.
One positive development was the switch from coal to gas substitution. Globally, this accounted for 24bn m3 of the increase in gas demand in 2018. The IEA estimates that “coal-to-gas switching avoided almost 60mn mt of coal demand, with the transition to less carbon-intensive natural gas helping avert 95mn mt of CO2 emissions.
Without this coal-to-gas switch, the increase in emissions would have been more than 15% greater. This switch, most significant in China and the US, reduced emissions by 45mn mt and 40mn mt respectively.”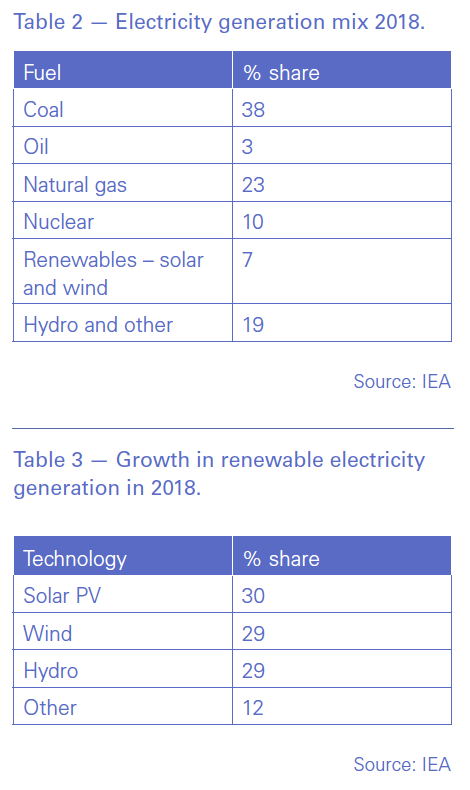
Renewables
Renewable growth is still going strong, providing a quarter of the growth in primary energy demand in 2018 (Figure 2) and 45% of the global electricity generation growth. Most of it was provided by solar and wind which continued to grow at a rapid pace. Global solar PV power alone increased by more than 30%, followed by wind and hydro with 29% each (Table 3).
However, despite this, Birol said, “renewable growth is not keeping pace with the electrification of our society,” adding that “despite major growth in renewables, global emissions are still rising, demonstrating once again that more urgent action is needed on all fronts.”
Most of the increase in renewable power, both solar and wind, was in China, accounting for 40% of it (Figure 3). Europe also saw major growth in renewables, with a quarter of the global total.
The increase in the use of renewables in the power sector had a substantial impact on carbon emissions – without it these would have been 215mn mt higher. The major contribution was from China and Europe.
However, as IEA pointed out: “Overall, the use of renewables needs to expand much more quickly in all sectors to be on track to meet long-term climate goals and cleaner air objectives.”
Coal
Global coal burn rose 0.7% in 2018 – for the second year running. The biggest growth was in China and India (Figure 3), but it also rose in Indonesia, Vietnam, the Philippines and Malaysia. And even though it declined in the US, Europe and Japan, the drop was not enough to offset these increases.
With a 38% contribution (Table 2), it remains the largest source of electricity generation.
The IEA said: “Despite growth in coal use, fuel switching between coal and gas accelerated in 2018, reducing the carbon intensity of global energy use.” This was driven by economics and government policies.
Altogether, 2018 was a remarkable year for renewables and natural gas. But it also provided a rude awakening with regards to carbon emissions.