


Gazprom Flows to EU, UK Rise in February
The transit deal signed on the 29 December 2019 between Gazprom and Naftogaz provides for 65bn m3 transit volumes for 2020. As the annual figure is to be delivered evenly at the rate of 178mn m3/d[1] or 5.5bn m3/month, any lower historical flow cannot be offset by higher contracted flows later. For higher flows, Gazprom would need to (directly as a registered shipper or again via Naftogaz) book additional capacity to the operator Gas Transmission System Operator of Ukraine (GTSOU). With lower than contracted transit flows in January-February, this means that the maximum contracted[2] volume via Ukraine could now only be 61bn m3 for 2020.
.PNG)
Following TurkStream start-up, flows from EU to Turkey at the Strandzha-Malkoclar border stopped January 8. If, as we expect, those flows remain at zero for the next few months, we will remove the above graph from our monthly analysis and will replace it by this historical analysis.
.PNG)
Gazprom’s flows were in February 2020 again down massively vs last year (-18.6%) and slightly up vs last month (+5.1%). The transit route via Ukraine recovered massively (+47.2% vs January 2020) even if still below the transit agreement.
.PNG)
EU domestic potential demand growth[3] and certain production decline cannot rebalance this storage overhang alone. Gazprom is in the driving seat to rebalance the EU system, but the path is narrow as it needs to fine tune its own exports and the EU price to reduce LNG arrivals while staying profitable to provide the economic benefit the Russian state is expecting…
.PNG)
Gazprom is prepared to reduce its exports to rebalance the storage overhang situation but not to make room for unlimited LNG. This means that other suppliers will have to cut, either proactively or following a market signal (ie lower prices). After having already reduced production by 6.4bn m3 in 2019 vs 2018, Norway could cut again proactively this year (c. - 7bn m3). It is therefore possible to have a better understanding of the global spare production capacity, that after trending down in 2016-2018 is now growing again with Gazprom not being the only producer to swing supply any longer.
.PNG)
This growing spare capacity is negatively impacting prices. It is worth mentioning that the gas spare capacity number (just around 2.5%) is strikingly similar to which exists in the oil markets where there is 2.6mn b/d of global spare oil production capacity[4], against consumption levels of 102mn b/d. In today market where Coronavirus caused havoc, both oil and gas producers will have to stop production to rebalance markets. Hence with some US LNG cargo already cancelled, we monitor monthly the EU & UK regas flows. Y-t-d, regas send-out was up 34% (+5.2bn m3). If LNG regas send-out growth reaches 8bn m3 we should expect further price reaction as neither Norway nor Gazprom would want to take further pain in cuts.
.PNG)
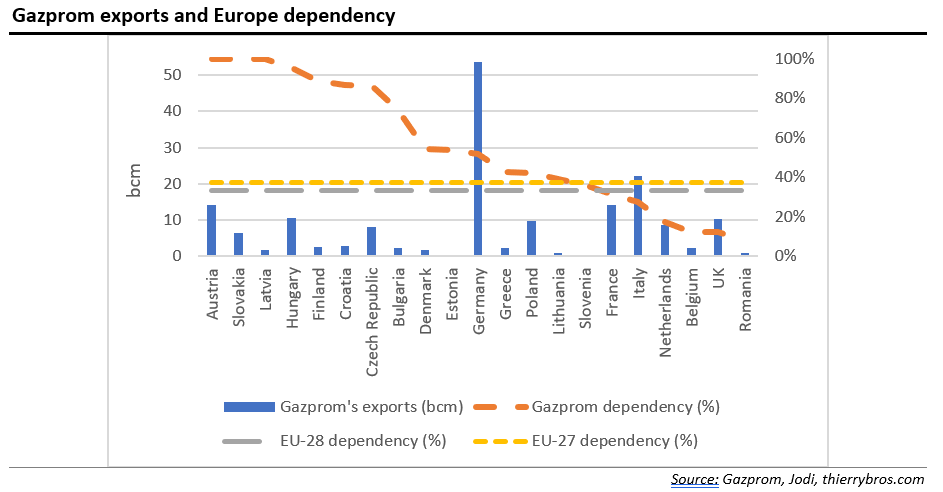
With Gazprom having disclosed its 2019 sales by countries and with statistics from the Joint Organisations' Data Initiative (Jodi) just been released[5] we can calculate that the EU-27 dependency on Gazprom is 37% in 2019. This is exactly between the Gazprom target (above 35%) and the level that could be detrimental for a competitive market level playing field[6].
Thierry Bros
March 3, 2020
Advisory Board Member, Natural Gas World
[1] https://interfax.com.ua/news/interview/635485.html
[2] 65 bcm – 4 bcm under shipped Y-t-d = 61 bcm
[3] We assume 0 bcm demand growth and a drop of 8 bcm in EU domestic production in 2020 vs 2019
[4] https://www.eia.gov/finance/markets/crudeoil/supply-opec.php
[5] Bulgaria, Croatia, Malta and Romania haven’t yet provided all data for December 2019 that we have estimated as the same as in December 2018.
[6] In EU Antitrust procedures in abuse of dominance “Market shares are a useful first indication of the importance of each firm on the market in comparison to the others. The Commission's view is that the higher the market share, and the longer the period of time over which it is held, the more likely it is to be a preliminary indication of dominance. If a company has a market share of less than 40%, it is unlikely to be dominant.” http://ec.europa.eu/competition/antitrust/procedures_102_en.html