


US summer prices at 20-year lows [NGW Magazine]
Record US gas supply has pushed Henry Hub prices this summer to 20-year lows, leading to depressed prices in the US and contributing to a wider global surplus.
US Henry Hub gas prices this summer (June 1–August 31) averaged just $2.28/mn Btu, which was about 20% below summer 2018 and the lowest for two decades1. They dipped as low as $2.02/mn Btu on 5 August (the lowest daily close since spring 2016), before recovering slightly into the mid-$2.30s/mn Btu by the end of the month.
Spot gas prices elsewhere in the US and Canada were often even lower, especially near the large producing basins. These North American prices remain below Asian spot prices, but, in early September, UK NBP prices dipped even lower -- partly due to a queue of US LNG cargoes in the Atlantic looking for a home -- and many observers see little significant support until 2021-22.
The US and international market weakness is eroding the returns and share values of the major oil and gas producers that have focused on gas/LNG, such as Anglo-Dutch Shell and French Total, while the low US prices have seen several gas-focused US independent producers go under. Shell’s Q2 profits slumped to the lowest level in two years, with shares down 20% over recent months, and it has postponed a US export terminal (see below).
Much of the gas produced in the US today is associated gas from shale oil production, which tends to rise in line with oil output, irrespective of gas prices. Where possible, producers are cutting back on upstream gas investment, with recent months seeing the sharpest rig number declines at dry gas basins, such as Haynesville and Marcellus. But when it is produced as a byproduct, the gas flows according to the oil economics – and at very low cost. The issue is particularly acute in the Permian Basin, where a lack of export pipeline capacity and rapidly rising oil and gas output has led to widespread flaring, along with some gas reinjection, which can boost oil output from fracked wells. The surplus means a slowdown in US capex this year is likely to cut flaring and reinjection rather than eating into gas production growth.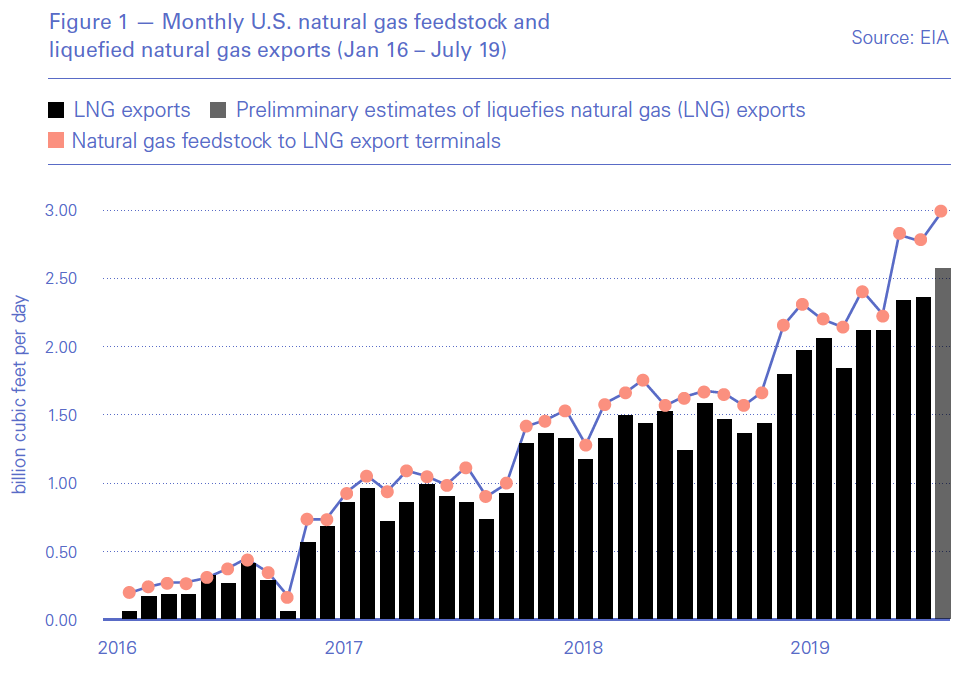
Record demand
The cheap US prices have also helped encourage demand growth, but not by enough to absorb all the additional supply and push prices back up again. Gas consumption in 2018 totalled 29.96 trillion ft3, up from 27.13 trillion ft3 in 2017, according to the Energy Information Administration (EIA). The previous high was 27.44 trillion ft3 in 2016. The figures are higher still for 2019 so far, with 13.53 trillion ft3 used up to the end of May, compared with 13.17 trillion ft3 over the same period last year.
The biggest expansion has been in the US electric power sector, driven by record levels of power consumption, combined with a rise in gas-fired capacity (often in combination with renewables and at the expense of coal), leading to record levels of gas-to-power demand. In the hour up to 6pm ET on July 19, hourly electricity demand peaked at a record 704 GW, according to the EIA. This caused gas-to-power demand to reach a record 44.5bn ft3 that day in the Lower 48 states. The record was also broken in 2016 and 2018 -- when it reached 43.1bn ft3/d -- illustrating the steady rise over recent years. US power demand peaks during summer heat waves thanks to high cooling demand.
The gas price outlook for this winter is also bearish, with gas storage having filled quickly this summer. During the first 12 weeks of the 2019 summer gas refill season, net injections into underground storage totalled 1.17 trillion ft3, according to Kallanish Energy -- which put cumulative net injections 41% above last year and an all-time record for mid-summer, with stock levels 171bn ft3 below the five-year average. Since then, weaker injection demand has kept downward pressure on prices through August.
Record exports
In addition to rapid domestic demand growth (in petrochemical feedstock, as well as power), cheap US gas has also been driving exports of pipeline and liquefied natural gas (see chart). US monthly LNG exports surpassed 5bn ft3/d for the first time in July (accounting for about 6% of total US dry gas production), up from just over 3bn ft3/d a year ago and from zero less than four years ago in early 2016. US exports of LNG now amounts to a tenth of the global market, and at 22mn mt so far this year (end-August) is equal to the total volumes pumped out in 2018, according to Refinitiv data. This LNG export growth has outpaced all other sectors so far this year. Deliveries by pipeline to Mexico added another 4.9bn ft3/d to exports in July, although this was only up modestly from 4.2bn ft3/d in 2016, following the construction of several new export routes.
The US has now been exporting more gas than it imports on an annual basis since 2017 and exports are expected to keep rising as new LNG facilities begin operation. About 30mn mt/yr of new US capacity is due to come on-line the rest of this year and in 2020 (including the Freeport project in Texas, which shipped its first commissioning cargo September 3), before additions ease in 2021. Beyond that there will be further export capacity growth, following final investment decisions (FID) this year on over 35mn t/yr of new US LNG liquefaction plants, including ExxonMobil/Qatar Petroleum’s Golden Pass; Venture Global’s Calcasieu Pass; and Cheniere’s Sabine Pass Train 6 - which will all come online in the early to mid-2020s. A decision on the small Woodfibre LNG plant in British Columbia, Canada, is also still expected this year, as is the Goldboro LNG plant in eastern Canada.
However, the current low international spot LNG price could pose a problem for US projects with higher cash costs, especially if they have no term oil-linked exports contracts. By early September, spot sales to Europe were not profitable, with UK NBP prices below US Henry Hub, although sellers continue to break even on sales to Asia. And on September 4, Shell asked US regulators to extend the time by which it should complete the Lake Charles LNG export project by five years to 2025, taking it out of the running for capacity additions in the early 2020s.
It remains to be seen whether all the planned LNG export schemes get built, but there is little doubt there will be plenty of gas for all of them. This is likely to cap future gas price gains in markets across the globe, as well as keeping a lid on domestic US prices.