


US energy becomes cleaner [NGW Magazine]
The US Energy Information Administration issued its short-term energy outlook (STEO) in April and its Annual Energy Outlook (AEO) in January, covering the period to 2050. Given the enormous impact of US oil and gas production and exports on global energy, we examine in the following their main findings.
As with the International Energy Agency’s scenarios, these do not claim to predict what will happen, but project what may happen based on the range of assumptions and methodologies used by the EIA in its models.
Its reference case represents its best assessment of how US and world energy markets will operate during the reference period, assuming expected improvements in known energy production, delivery and demand trends, based on today’s laws, policies and trends in technology. Unless otherwise stated, the results below are based on the reference case.
A key conclusion is that the US, along with the rest of the world, is inexorably moving towards cleaner energy. Other key findings are that:
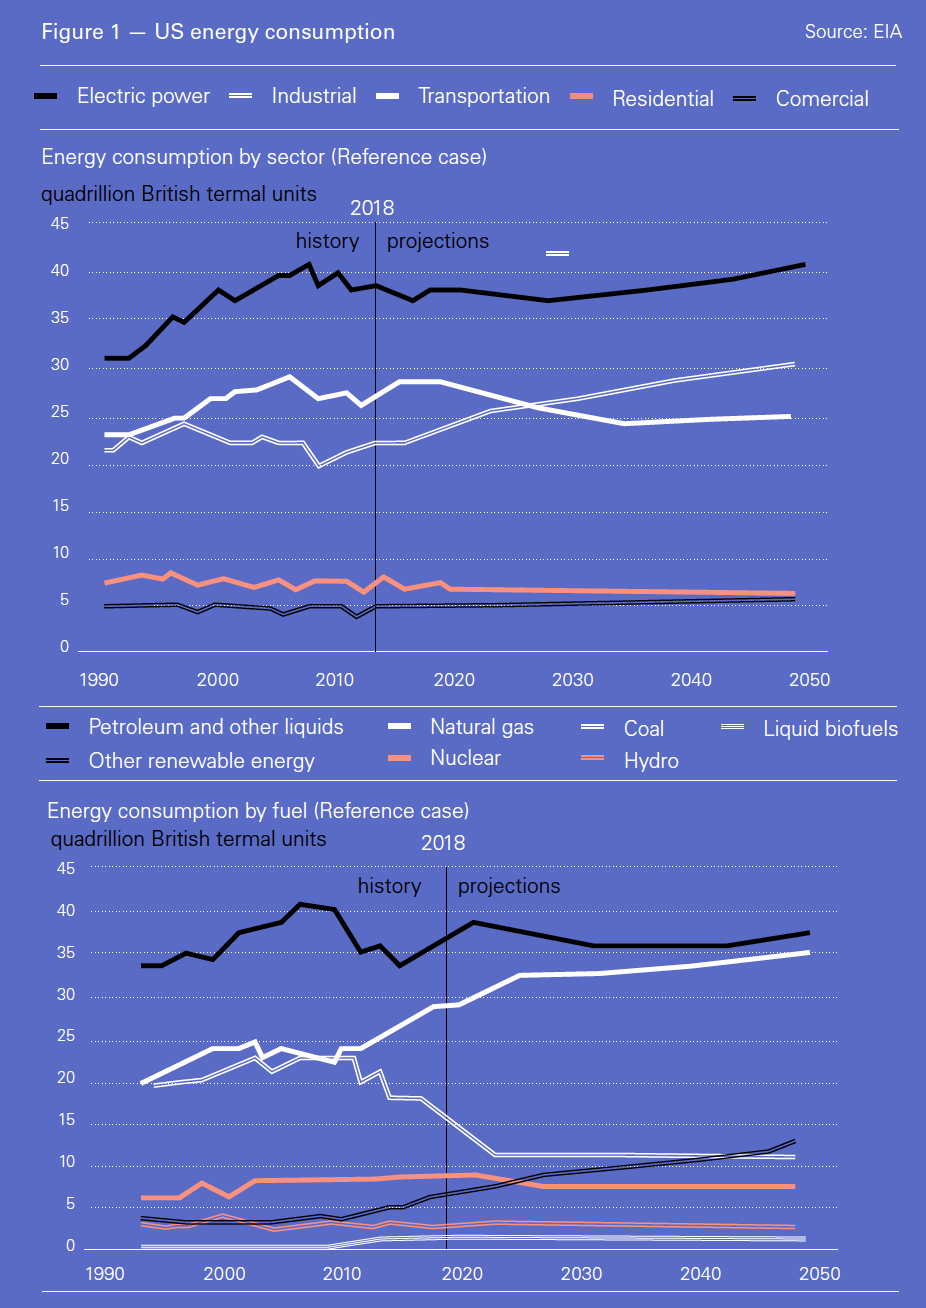
- Overall, US energy demand rises, but slowly, with less coal and nuclear offset by more natural gas and renewable energy (Figure 1).
- Oil and natural gas production keeps rising, with the latter having the highest production growth (Figure 2). Crude oil production is expected to exceed 14mn barrels/d by 2030 and stay at that level until 2040, driven by continuing development of tight or shale oil and gas resources.
- This leads to low domestic natural gas prices, and more use of gas in all end-use sectors (Figure 3).
- It also boosts energy exports, including LNG, with the US becoming a net energy exporter in 2020 and remaining so to 2050.
- This is also driven by a slow growth in domestic energy demand as efficiency rises across all end-use sectors, even as the US economy continues to expand.
- Economic growth and low energy prices benefit the industrial sector, and particularly bulk chemicals, with a substantial growth in industrial demand over the reference period
- The US power sector also grows, driven by low-priced natural gas and renewables. These will carry on rising in the period to 2050, while less economically viable nuclear and especially coal will decline.
- This leads to a continuous decline in energy related CO2 intensity throughout the reference period, but overall energy-related emissions remain largely flat to 2050, due to the increase in natural gas consumption in all sectors (Figure 8).
Natural gas
US gas supply outpaces output in all cases, resulting in low prices and surplus gas for export. In the reference case dry natural gas production will reach 43 trlllion ft³/yr by 2050.
Drilling in shale formations primarily depends on crude oil prices rather than natural gas prices. Nevertheless, development of tight and shale resources will account for nearly 90% of dry natural gas production in the US.
By the mid-2020s, EIA projects that the US industrial sector will become the largest consumer of natural gas, using it as a feedstock in chemical industries, for industrial heat and power applications, and for LNG production. The residential and commercial sectors are also expected to continue using more natural gas (Figure 3).
But, as Figure 2 shows, there will be rising amounts of surplus gas available for export. Some of this will exported through pipelines, mostly to Mexico, but the bulk will go towards LNG exports (Figure 4). This could reach as much as 14bn ft³/d by 2030, making the US one of the largest LNG exporters in the world.
But even EIA recognises that competition will intensify as global LNG supply rises. First, as a result of Asian countries preferring to avoid energy import dependency; and second, as the energy transition leads to structural changes in what is becoming an over-supplied global energy market.
Another important factor is that in developing countries the future of natural gas, and invariably imported LNG, is dependent on prices.
Given the potential impact of these factors, future LNG demand is unlikely to carry on going up at the speed experienced during the last two years.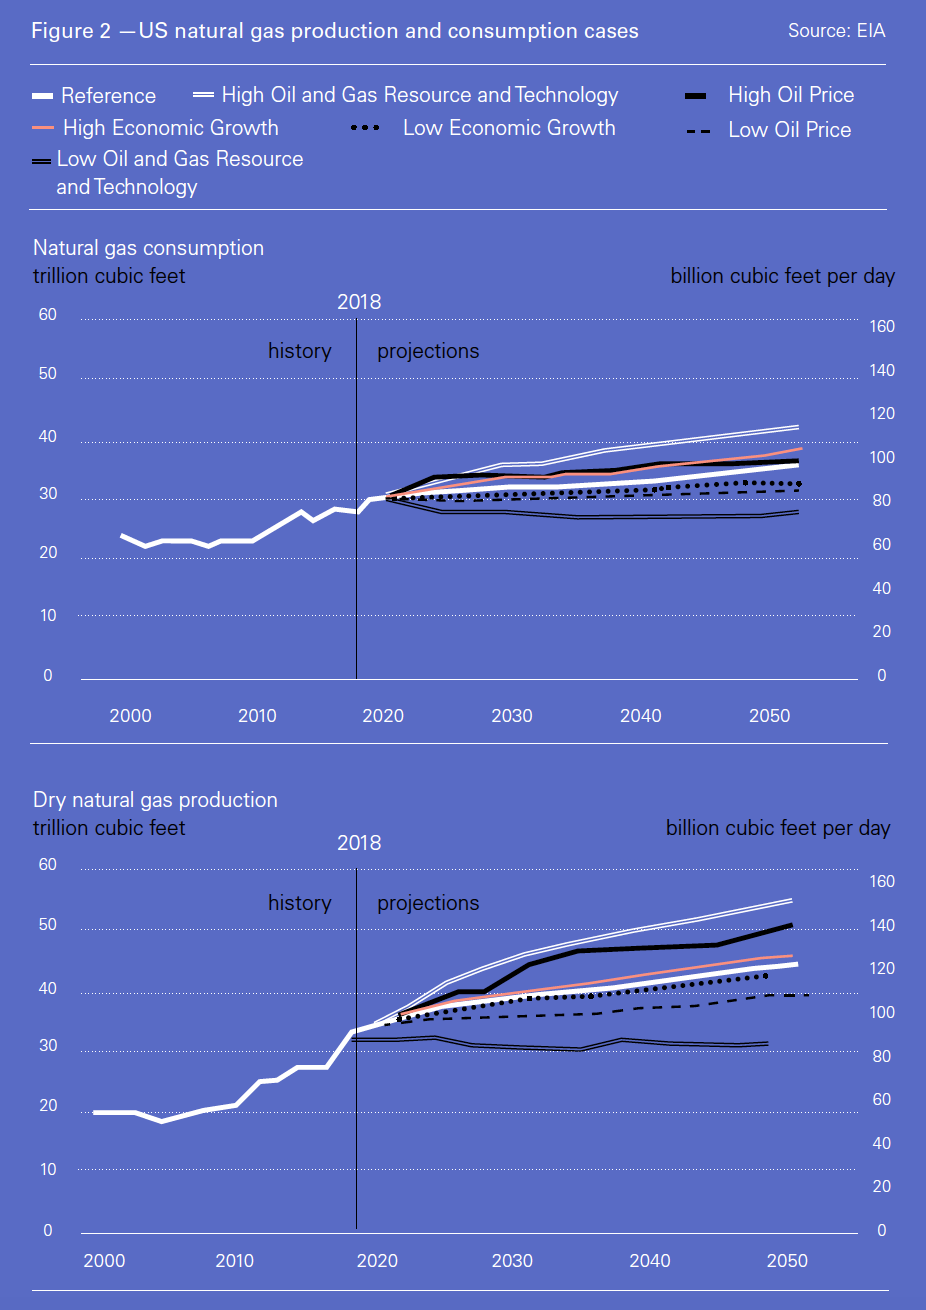
If US LNG is to succeed in such markets, prices must come down, perhaps by integrating production with marketing. Access to cheap feed gas will be critical.
Given that much of this is associated gas, being able to export it becomes critical if it is not to hinder oil production. An example is the Permian, which has large quantities of associated gas.
Permian crude oil and NGL production is expected to grow from 3.3mn b/d in 2017 to 8.8mn b/d by 2025, with associated gas production rising from 7.1 to 16.0bn ft³/d over the same period. Being able to use this gas is critical to realising Permian’s oil production potential, and several LNG export projects, such as NextDecade and Tellurian, are predicated on this.
Where this is not possible, much of the gas is flared. It is estimated that Permian flaring reached as much as 0.28bn ft³/d associated gas in 2017, or about a tenth of the LNG that the US exported last year. However, restrictions in flaring mean that either the gas has to be used or wells must be shut.
Given that oil production is what drives investment decisions in the Permian, associated gas can have a negative value. Combining this with LNG production can make US LNG more competitive in global markets – in comparison to Henry Hub price-linked LNG.
But ultimately, US LNG exports are sensitive to both oil and natural gas prices (Figure 5).
Note: the oil to gas price ratio is based on converting gas barrels of oil equivalent (boe)
The EIA also states that “as more natural gas is traded via short-term contracts or traded on the spot market, the link between LNG and oil prices weakens over time, making US LNG exports less sensitive to the crude oil-to-natural gas price ratio and causing growth in US LNG exports to slow in all cases.”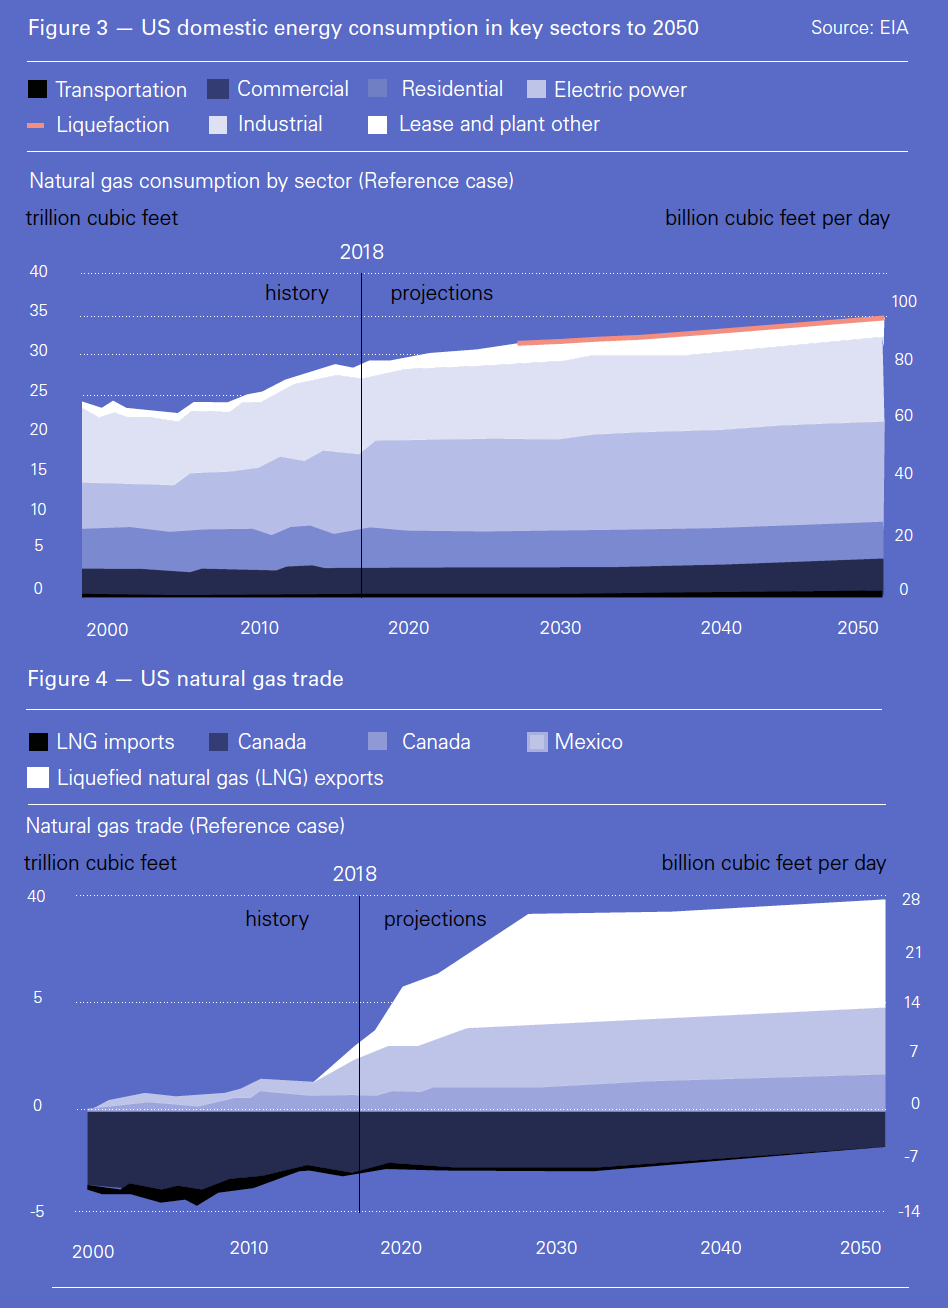
By the end of 2018 total US LNG export nameplate capacity rose to 4.3bn ft³/d, with another 4.0bn ft³/d of liquefaction capacity expected to be added by the end of 2019. EIA’s STEO forecasts that US net natural gas exports will average 4.7bn ft³/d in 2019, rising to 7.5bn ft³/d in 2020, with most of the growth feeding LNG exports. In fact STEO forecasts that dry natural gas production will average 91.0bn ft³/d in 2019, increasing to an average of 92.5bn ft³/d in 2020.
Electricity generation
Cheap natural gas and declining costs of renewables result in long-term low-cost electricity in the US. These also cause the share of nuclear and coal-fired power generation to decrease (Figure 6).
The share of renewables in US power generation will see a massive increase from 18% in 2018 to 31% by 2050. But even then, with a continuous price decline natural gas continues to provide the largest contribution to US electricity, increasing from 34% in 2018 to 39% by 2050.
Coal declines substantially, but still provides 17% of electricity in 2050. Combined with natural gas, fossil fuels will still be providing over 50% of US electricity generation mix by 2050.
The largest renewables growth will come from solar pv, which by 2050 will be providing almost half of all renewable electricity, 48%, in comparison with 13% in 2018.
Despite support from the government, coal-fired power generation faces an inexorable decline thanks to the onslaught of persistently low gas prices and cheaper renewables. New additions to generating capacity will be met largely by natural gas and renewables.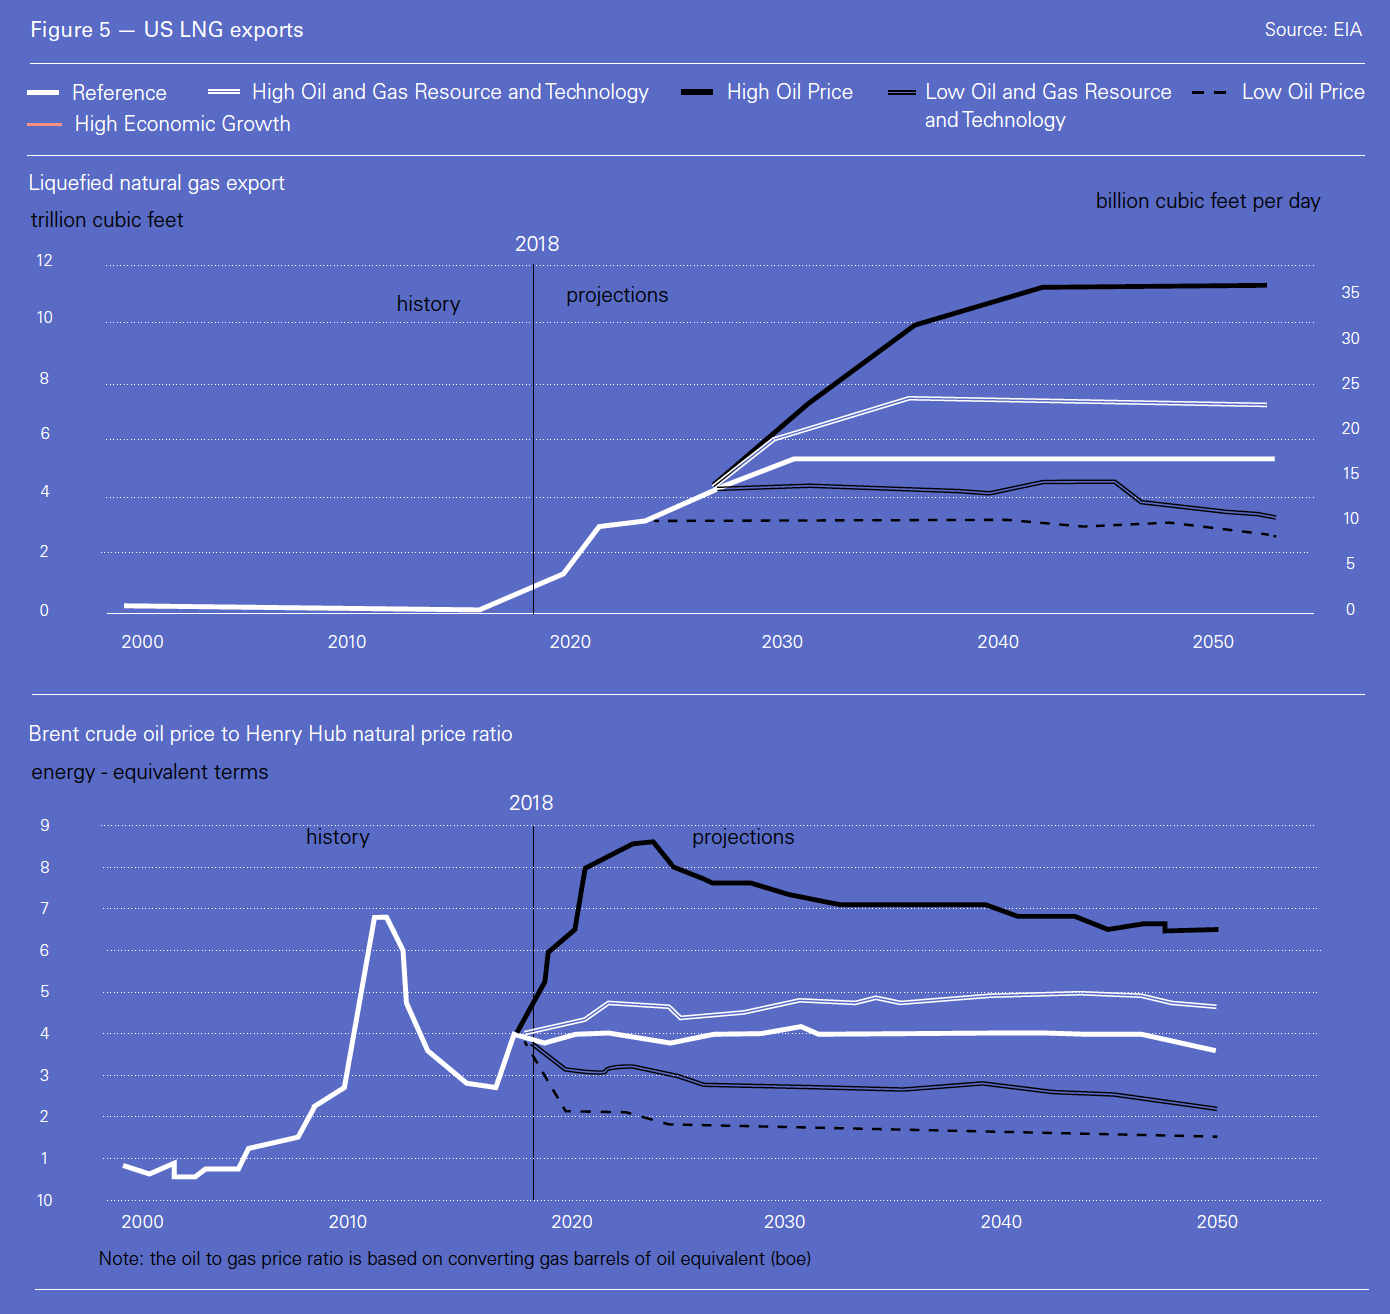
CO2 emissions
US energy-related CO2 emissions are expected to remain close to current levels throughout the reference period (Figure 7), with only a 4% reduction from 2018 levels. These put the US far behind the climate change targets established in the Paris Agreement. 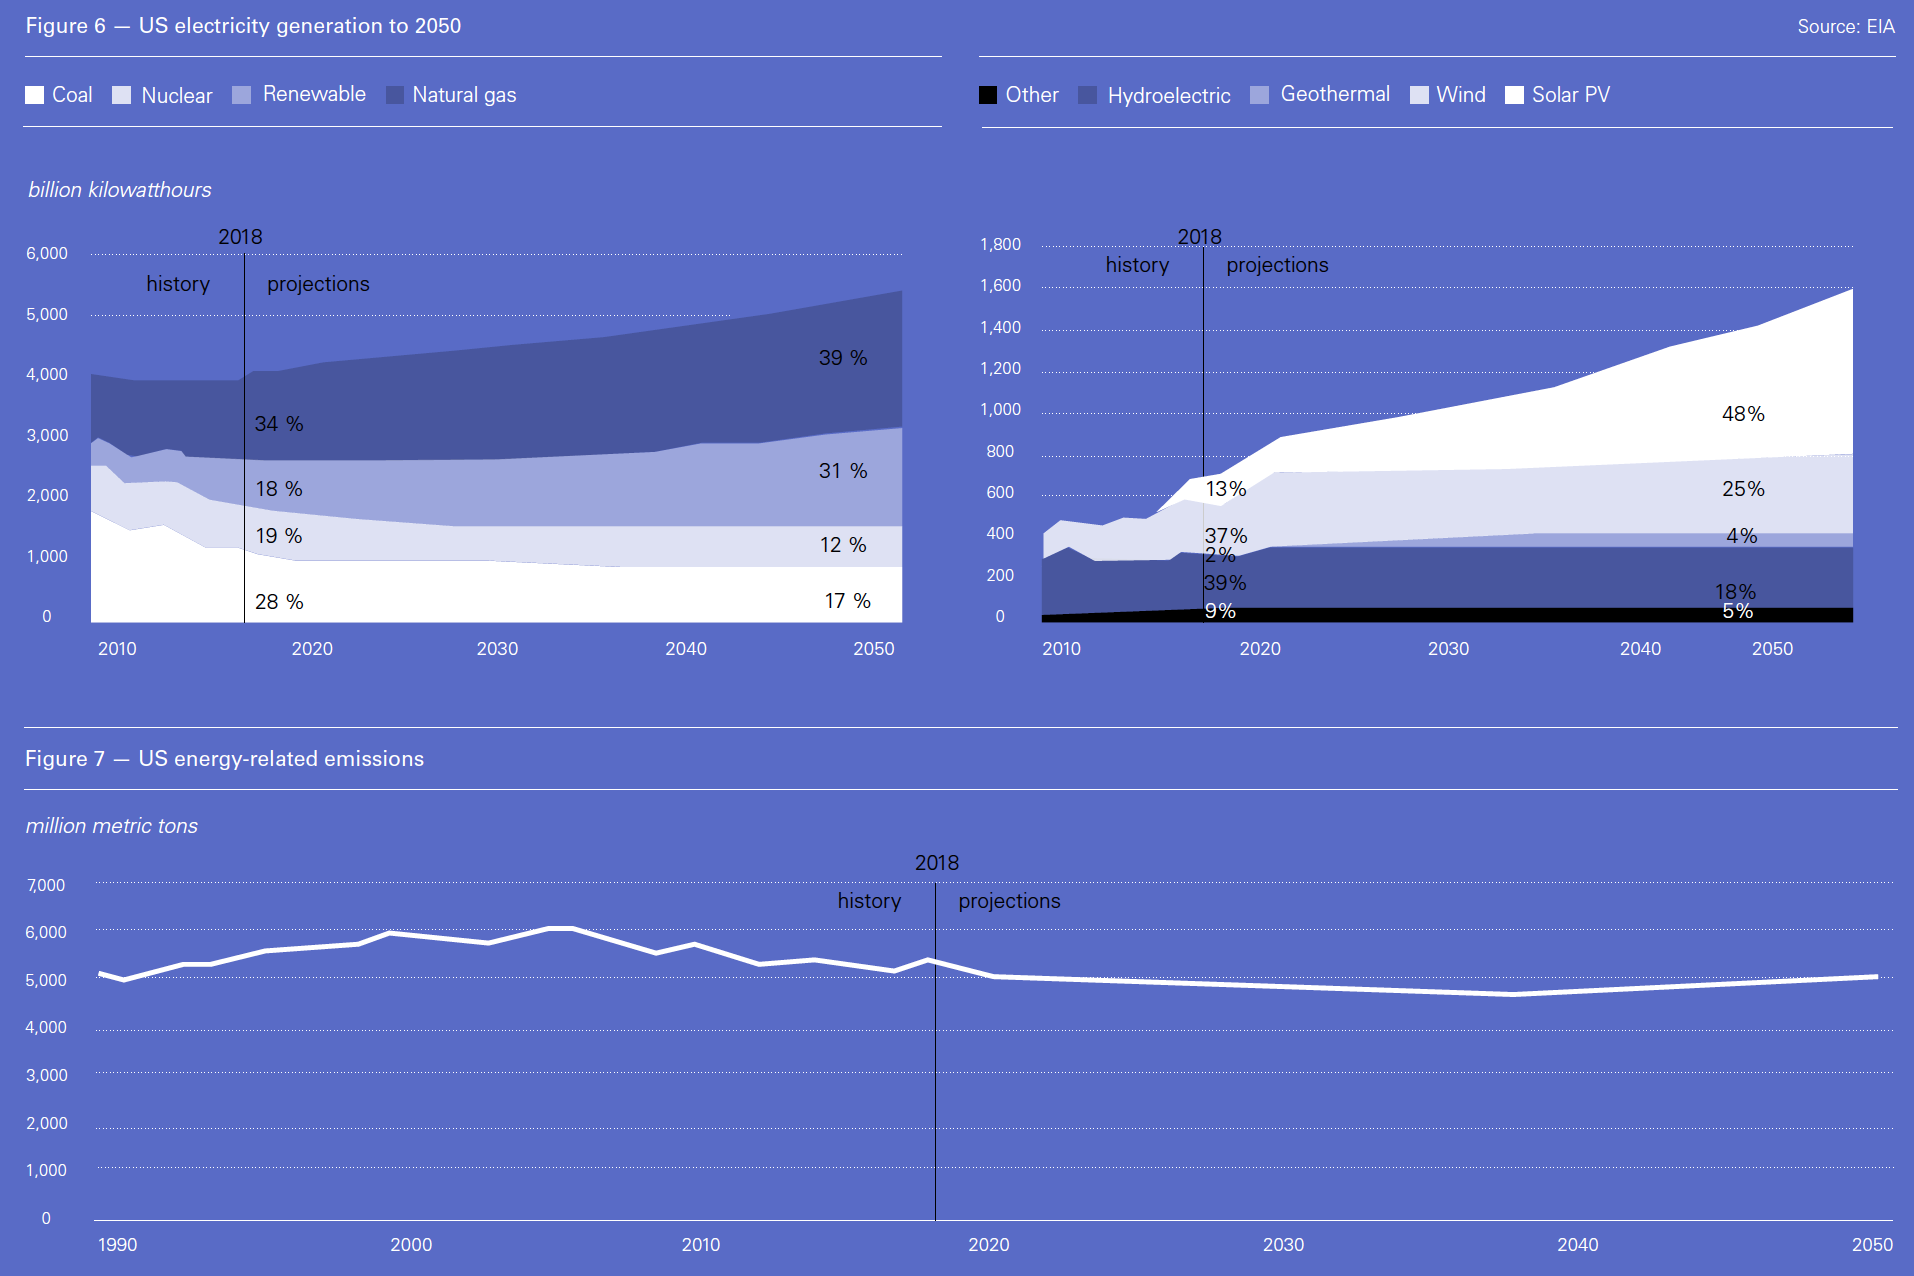
Oil and coal-related emissions will decline, reflecting the reduction in oil and coal consumption. However, these will be offset by natural gas-related emissions in future (Figure 8), despite the fact that natural gas is the least polluting fossil fuel. In fact natural gas emissions surpassed coal emissions in 2015. Future CO2 emissions follow closely energy demand trends.
Greater reliance on cheap gas presents problems for CO2 emission reduction efforts, both by crowding out renewable energy deployment and by pushing more expensive, but carbon-free, nuclear plants into retirement.
In fact US energy-related CO2 emissions rose by 3.4% in 2018 after three years of decline, primarily as a result of a 4% rise in primary energy demand in comparison to 2017. Evidently, CO2 emissions are not yet decoupled from energy consumption, as is often wishfully claimed.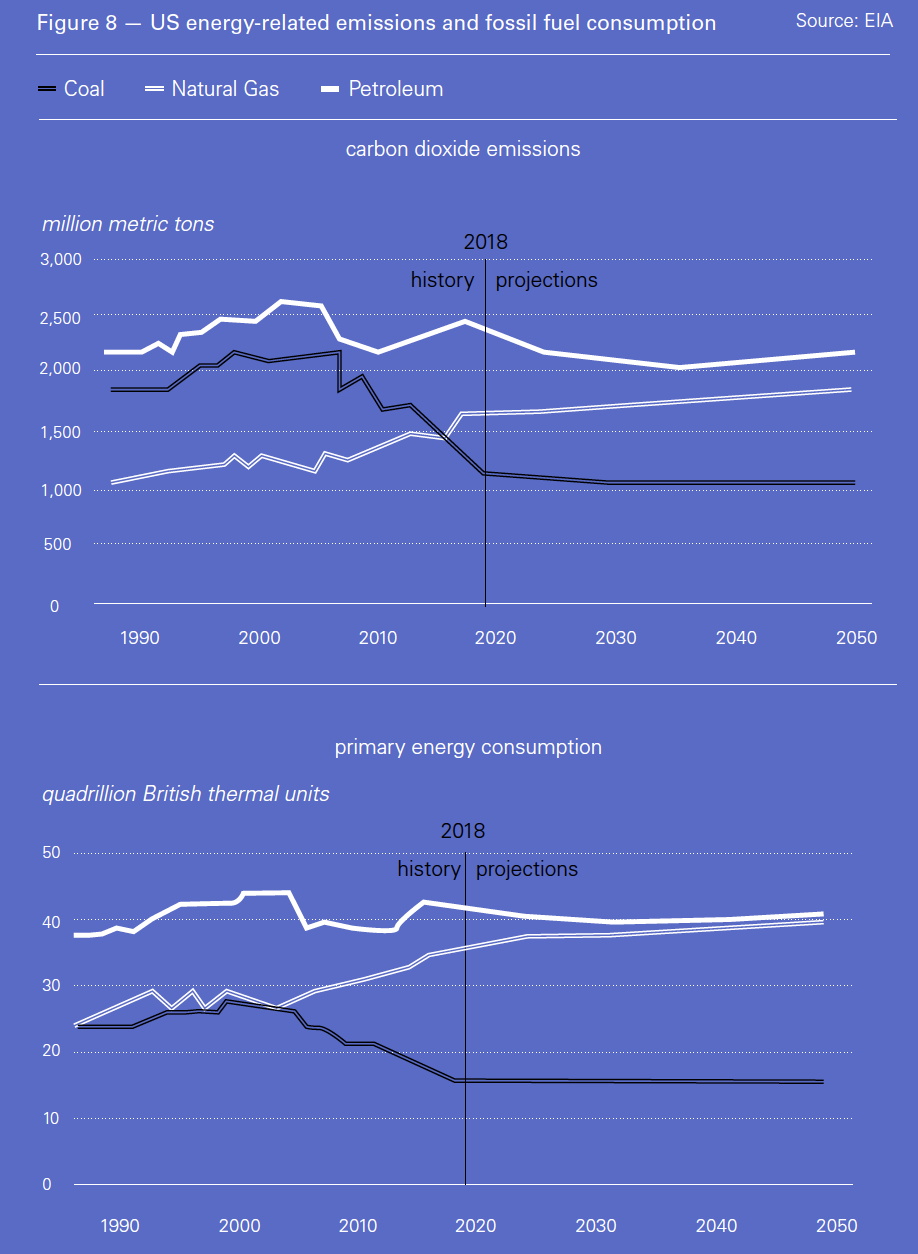
The EIA does not expect carbon capture and storage (CCS) technologies to achieve sufficient market penetration to seriously mitigate CO2 emissions under current laws and regulations.
Clearly current laws and policies and extension of current technology alone will not help achieve meaningful reductions in US CO2 emissions. This can be achieved only through new, more aggressive, policies, possibly including introduction of carbon-pricing, and step changes in technology.
But it will not be driven by the present US government. In an interview in the Financial Times, Andrew Wheeler, the top US environment regulator, said: “We need to be decreasing our CO2 and greenhouse gas emissions… But we are not going to focus on that to the detriment of other environmental indicators,” such as potable water and affordable electricity. In a way this reflects polls which show that climate change ranks relatively low on US voters’ list of concerns.
Implications
Given the assumptions made by the EIA – clearly stated in its published reports – the findings presented in AEO and STEO must be treated with caution. In the longer-term it is likely that future changes in policy and regulations, technology advancements and economics will affect US energy production and consumption in ways not anticipated in these Outlooks.
This is perhaps the reason why EIA Outlooks often attract criticism as being overly conservative – they are not forecasts – and that they repeatedly under-represent the growing role of renewables.
However, the expectation that US natural gas production and exports will carry on increasing, in line with US oil, is becoming a key factor in global energy markets.
As EIA administrator Linda Capuano said: “The US has become the largest producer of crude oil in the world, and growth in domestic oil, natural gas, and renewable energy production is quickly establishing the US as a strong global energy producer for the foreseeable future.”
Despite US sanctions on Iran and Venezuela and unplanned outages in Libya, Angola and Russia, oil price declines remain relatively modest. This is mainly because of increasing US oil production and rising crude stockpiles – as well as Saudi Arabia’s pledge to produce more.
As EIA’s AEO shows, the outlook for US shale oil and gas production continues to be bright in the longer-term. This makes it possible for global markets to be in a stronger position to deal with supply disruptions and outages, thus steadying global oil prices.
As the FT says, it also means that “the $100-a-barrel oil era remains a distant memory, as the long-term outlook for supplies has flipped from scarcity to plenty.” US oil and gas production appears to be providing a steadying influence.
A controversial finding, based on the assumptions made by the EIA, is that coal will still be providing 17% of US electricity in 2050. A Bloomberg NEF forecast shows coal’s contribution down to 1.9% by 2050.
In terms of CO2 emissions, it is clear from AEO that without aggressive policy action, the US will not achieve the emission reductions needed to meet global climate change targets. The availability of plentiful cheap gas makes this a challenge. Business-as-usual alone does not appear to be able to deal with this. Adoption of more aggressive policies and carbon-pricing may be what is needed. Certainly experience in the UK has shown that carbon-pricing can be a major factor in reducing CO2 emissions more quickly.
EIA’s AEO provides a useful and comprehensive outlook of how US energy will develop in future, even if constrained by the assumptions this is based on.