


The role of gases in the European energy transition [GGP]
The role of gases in the energy transition is a different, and much more immediate, issue in the EU, compared with other global regions. Net zero targets for 2050 mean that in order to retain the gas market and the extensive network infrastructure which has been developed, zero carbon gases will need to be developed, and natural gas (methane) will need to be decarbonized. Maximum availability of biomethane and hydrogen from power to gas is estimated at 100–150 billion cubic meters by 2050 (or around 25–30% of gas demand in the late 2010s. Therefore, large scale hydrogen production from reforming methane with carbon capture and storage (CCS), or pyrolysis, will be needed to maintain anything close to current demand levels. Costs of biomethane and hydrogen options are several times higher than prices of natural gas in 2019–2020. Significant financial support for decarbonization technologies — from governments and regulators — will therefore be needed in the 2020s, if they are to be available on a large scale in the 2030s and 2040s. If the EU gas community fails to advance convincing decarbonized narratives backed by investments which allow for commercialization of renewable gas and methane decarbonization technologies; and/or governments fail to create the necessary legal/fiscal and regulatory frameworks to support these technologies, then energy markets will progressively move away from gases and towards electrification.
1. European and global natural gas demand projections under COP21 and net zero targets
|
Advertisement: The National Gas Company of Trinidad and Tobago Limited (NGC) NGC’s HSSE strategy is reflective and supportive of the organisational vision to become a leader in the global energy business. |
Since 2017, the Oxford Institute for Energy Studies has published a series of papers on the future of natural gas in the energy transition focused on Europe but including wider geographical considerations. The focus on Europe is justified by the measures and commitments that, principally European Union (EU), governments have made and continue to make in relation to greenhouse gas (GHG) emissions’ reduction. This is particularly important for countries which currently export large volumes of gas to Europe through pipelines and liquefied natural gas (LNG) terminals.
An overview of European gas scenarios for the period up to 2050 suggests that the 2020s could see robust demand and a need for more pipeline gas and LNG imports (and probably new import infrastructure) due to: declining domestic production, reduced use of coal and nuclear power, and gas use in tandem with rising renewable generation. But after (and even possibly before) 2030, the future of gas demand in Europe is expected to decline, a trend set to accelerate through the 2030s and 2040s, particularly if “net-zero” targets are adopted. The COVID-19 pandemic significantly reduced European gas demand in 2020, but is not expected to substantially change the long-term future for the fuel. But this could change if a significant share of the new funding under the Multilateral Financial Framework and the Next Generation EU funds, agreed by the EU in July 2020, is targeted at energy and natural gas decarbonization(European Council, 2020)._f550x378_1608111646.jpg)
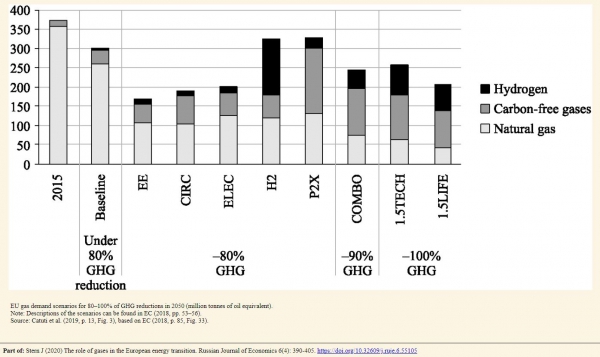
Fig. 1 shows examples of public domain projections of EU natural gas demand for 2040 and 2050. All but one of the projections show the trajectory of demand if Europe is to meet COP21 targets and illustrate that natural gas demand remains relatively flat up to 2030 but declines rapidly to around half the level of the 2010s between 2040 and 2050. However, the EU seems certain to adopt a net zero emissions target, and some member states have already done so, or expressed an intention to do so. Fig. 2 shows EU demand scenarios for all gases — including natural gas — under a range of greenhouse gas reduction targets including net zero (–100% GHG).
Fig. 2 shows that, under a range of scenarios, 80–90% emission reductions lead to methane demand of 90–150 billion cubic meters (bcm) in 2050, while net zero requires methane demand to fall further to 55–75 bcm. But demand for hydrogen and other carbon-free gases increases significantly. In the 80% emission reduction scenarios, total gas demand can remain close to 400 bcm equivalent (only around 10% below the levels of the 2010s) while total gas demand in the net zero scenarios could reach over 300 bcm. Despite the uncertainties of this type of modelling, it makes two important points:
This naturally leads to considerations of the future of gases in individual EU countries. There is no breakdown of the data by EU country but where governments are committed to rapid decarbonization, the post-2030 outcome is pre-determined if COP21 (let alone net zero) targets are to be met. These are the markets in the UK, Netherlands, Germany, France, Belgium, Italy, and Spain which, in the late 2010s, accounted for around 80% of EU gas demand and more than 60% of natural gas imports.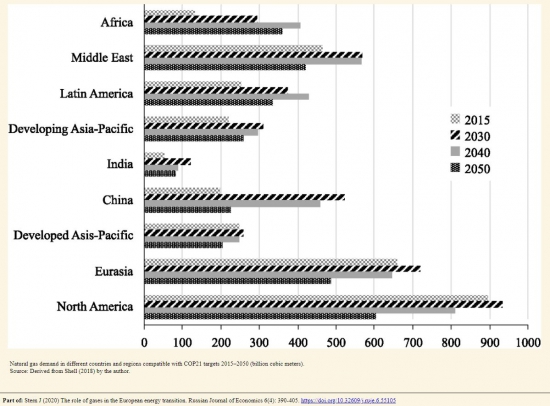
For countries outside the EU (and some other OECD countries) air quality and affordability issues are much higher up the energy policy agenda than decarbonization. This is not to say that the energy transition will not be important outside Europe, but in many of these regions phasing out fossil fuels can be expected on a much slower time scale and, particularly in the large energy demand centers in Asia, there is much less discussion of carbon reduction let alone net zero targets. Fig. 3 is from the Shell Sky scenario (which extends to 2100) providing natural gas demand scenarios for all regions. The overall picture is that in order to meet COP21 targets, demand needs to peak around 2040. There are significant differences between this scenario and those from other sources, particularly in relation to Chinese and Indian gas demand.
1.1. The response of the global natural gas community to the energy transition
Early in the 2010s the natural gas community adopted an “advocacy narrative”: that the carbon reduction benefits of coal to gas switching in power generation (and oil to gas in other sectors), and the advantages of gas in backing up intermittent renewables, would ensure that gas remains not just a transition — but also potentially a destination — fuel for a low carbon economy. This narrative was most prominent in Europe, but also advanced globally, mainly by international (oil and) gas producers and exporters. Although such arguments are highly persuasive from a short-term perspective, they do not address the priorities of national governments and the EU as a whole. This is because although they may result in early emission reductions, these will not be sufficient to meet 2050 COP21 commitments which are the increasing focus of government attention.
If gas is to maintain anything close to its current position in European energy balances gas post-2030, the gas community will need to move from its previous advocacy position to a “decarbonization narrative” which needs to include the following components:
- • commitment to a range of actions in relation to reducing the carbon (and methane) footprint of natural gas over a specific time period to fit with national carbon reduction targets;
- • a time frame for selecting and then rolling out low or zero carbon gas projects nationally or through specific networks (or regions);
- • technical, legal, fiscal, and carbon price/tax frameworks which need to be created by the European Commission, national governments, and regulators in order to achieve these options.
Decarbonization options for European gas markets will be very different in individual countries — and possibly regions of countries — and for this reason, as well as the fragmentation of the gas value chain which has resulted from liberalization, this paper refers to a European gas community with different interests and options rather than a gas industry which suggests a cohesive group with a unified purpose. This is why there is no single narrative for gas decarbonization, but different narratives which will depend on consumption patterns, existing infrastructure, available resources, geographies, and policies (both national and regional).
2. Development of non-fossil gases and methane decarbonization in Europe
The options for developing decarbonized gases are biogas, biomethane, synthetic natural gas, hydrogen from renewable energy, and hydrogen from reforming or splitting of methane.
2.1. Biogas and biomethane
The primary method of biogas production is the biological breakdown of organic material in the absence of oxygen known as anaerobic digestion. Biogas is principally used in local (mainly agricultural) networks to produce electricity, but it can be upgraded to biomethane by a variety of methods which can then be injected into pipeline networks and used interchangeably with natural gas. In 2017, biogas production in Europe was around 18 bcm but biomethane production was much smaller at 1.94 bcm (Bioenergy Europe, 2019, Table 2 and 4). A 2019 survey of renewable gases in Europe includes a database containing 497 operational biomethane projects most of which are located in Germany (46%), 20% in the UK and 7% in France and Switzerland (Lambert and Oluleye, 2019, Fig. 6b). Upgrading plants to achieve technical availability up to 96% results in an annual nominal potential for biomethane of 2.02 bcm/yr. Fig. 4 shows scenarios for biomethane production up to 2030 and 2050. The most optimistic of these sees the possibility of 98 bcm of biomethane from biomass sources by 2050.
Power to Gas (P2G) relies on the principle of electrolysis: using electricity to separate water into its component parts of hydrogen and oxygen. Scenarios of renewable hydrogen from surplus wind and solar power are around 50 bcm in 2050 with the majority of the increase post-2040. This suggests that unless a much larger surplus of low/zero cost renewable electricity becomes available, to significantly increase the scale of P2G dedicated off-grid renewable energy systems will need to be established in regions with high wind and solar resources with hydrogen being transported by pipeline to consumption centers.
2.2. Hydrogen options: reforming plus CC(U)S, and pyrolysis
In Europe, hydrogen is produced by the following fuels: gas 68%, oil 16%, coal 11% and electricity (electrolysis) 5% (DNV GL, 2018, Slide 12). Utilization of hydrogen from reformed methane is common in many parts of the world, but is mainly confined to the refinery sector and transported short distances to limited numbers of industrial customers. Large-scale methane reforming with carbon capture to produce hydrogen for network distribution to residential and commercial customers would be a completely new development.
Large-scale methane reforming to hydrogen with CCS is under serious consideration only in the UK and the Netherlands, while in southern Europe the initial emphasis has been more on biogas and biomethane development. The principal reason for this is the availability (or otherwise) of suitable offshore structures for carbon storage. Countries such as the UK and the Netherlands have offshore structures (depleted gas fields and aquifers) which are suitable for storing carbon dioxide. In central and southern Europe, lack of access to offshore storage structures means that the methane reforming option is logistically problematic and therefore less commercially viable. However, Italy and Spain are exploring the possibility of direct import of renewable-based hydrogen from North Africa through existing natural gas pipelines which would form part of a hydrogen “backbone” network (Wang et al., 2020).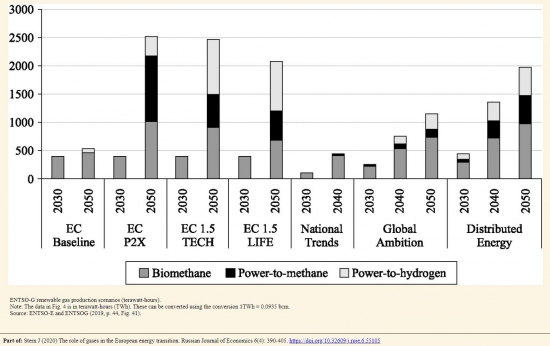
The emphasis on offshore structures is the result of onshore carbon dioxide storage being considered politically impossible in major European gas markets due to environmental opposition. The rationale for such opposition is not entirely clear but has been accepted, which means that large capacity offshore structures — with pipelines leading to those structures — will be required. It also suggests that large-scale CCS must take place pre-combustion rather than post-combustion. There are clear logistical advantages to gas producers reforming methane and producing hydrogen either at the field or where the gas is landed onshore. The advantage of pre-combustion CCS would be that only offshore carbon dioxide pipelines would be needed. The potential disadvantage would be that all networks and customers in those regions would need to be converted to hydrogen, unless a further step was taken to methanize the hydrogen into syngas onshore (“power-to-methane” in Fig. 4) which would add to efficiency losses and therefore to costs (Fig. 5).
 An alternative method of hydrogen production from natural gas is pyrolysis (or methane cracking) which splits methane into hydrogen and a solid carbon residue — carbon black — which can then be used in a range of industrial processes. Although the extent and scale of the utilization options for carbon black are uncertain, and large-scale storage would still be required, this could resolve some of the problems and costs of carbon dioxide capture and storage. The methane cracking process is currently at the laboratory testing stage and it remains to be seen how quickly it will develop. The next important step will be a small-scale plant to demonstrate the viability of the process.
An important conclusion from a review of the current progress of renewable and decarbonized gas options is that, to maintain anything close to the scale of the European gas market in the late 2010s, even the highest estimates of biogas, biomethane, and power to gas would need to be supplemented with the reforming of methane into hydrogen accompanied by carbon capture and storage. Fig. 4 is from ENTSOG’s Ten Year Network Development Plan (ENTSO-E and ENTSOG, 2019) and shows three new scenarios (right side of the figure) which are relatively consistent with those in Fig. 2 in terms of timing, but less ambitious in terms of volumes of power to methane and hydrogen.
It needs to be stressed that Figures 2 and 4 are presenting overall EU scenarios. They do not exclude — and indeed they specifically envisage — the possibility of individual countries, and particularly regions of countries, converting existing gas networks to a mixture of methane, biomethane, and hydrogen, or building new networks specifically to transport hydrogen. However, a 2019 database of renewable gas projects at different stages of development, from operation to planning, did not lead to an optimistic conclusion about the prospect of rapid development of commercial scale projects (Lambert and Oluleye, 2019).
In 2020, the EU published a three-stage Hydrogen Strategy which added some granularity to both the ambition and the funding of development. The first stage (2020–24) envisages 6 GW of electrolyser capacity, the second stage (2025–2030) capacity will expand to 40 GW and to 500 GW in the third stage (by 2050). In the first stage, hydrogen from local renewables or methane will be produced close to sites where it will be used. The second stage envisages retrofitting fossil-based hydrogen production with carbon capture which is when major new infrastructure development will be needed. For the period up to 2030, the Strategy envisages an investment of €24–42 bn in electrolyzers to which would need to be added: €220–340 bn to scale up and directly connect 80–120 GW of solar and wind capacity to the electrolyzers, €11bn for retrofitting half of the existing gas plants with CCS, and €65 bn for hydrogen transportation and storage infrastructure including refuelling stations (EC, 2020, pp. 7–8).
3. Time frames and costs
3.1. Time frames
EU targets dictate that the power sector must be largely decarbonized by 2030, followed by the heat and transport sectors in the two subsequent decades. Consequently, the time available to demonstrate whether methane can be retained in the energy balance on a large scale beyond the next 20 years is relatively short. Following this logic, certainly by the mid-2020s — and arguably today — it will no longer be possible to sign contracts for methane exceeding 10 years (and even this duration may be difficult) unless it can be demonstrated that methane decarbonization arrangements will be in place by the end of that period. Similar logic suggests that it will not be possible to recover methane-related infrastructure investments requiring a longer depreciation period. Therefore, the necessity to demonstrate that the different decarbonized gas options are technically feasible and cost-effective against alternative low/zero carbon options is urgent, in order to provide sufficient time for a large-scale gas network transition over the following 25 years up to 2050, particularly if there is a need to convert significant numbers of customers to hydrogen. This means that the pilot projects currently in operation will need to be followed relatively quickly by commercial scale projects in order to be operational by 2025. This will require the technical, legal, regulatory, and fiscal frameworks to be in place to allow final investment decisions to be taken in the early 2020s.
3.2. Costs
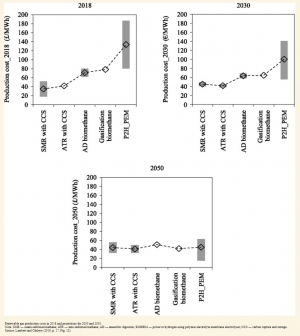
It is extremely difficult to make accurate cost estimates for the different decarbonization options. Fig. 5 shows cost estimates for a wide range of renewable gas options in 2018 with projections for 2030 and 2050. Only the lower end of estimates for steam reforming with CCS come even remotely close to European hub prices which ranged from €5–21/MWh in 2019 and the first half of 2020. By 2030 costs of reforming and biomethane (anaerobic digestion and gasification) are projected in the range of €40–60/MWh, while the cost range for power to hydrogen is very much higher. But by 2050, costs of all these gases are projected in the range of €40–60/MWh. The EU Hydrogen Strategy has current costs of fossil-based hydrogen at €45/MWh, and renewable hydrogen at €75–165/MWh (Barnes and Yafimava, 2020). This means there is no current “business case” for investing in these projects, specifically no expectation that they will earn a commercial return, and this will need to be addressed through policy and regulation. The major policy instrument will be substantial additional carbon taxation, and fossil fuel exporters to the EU have been alerted to the fact that a carbon border tax is under active discussion in Brussels. The formulation and timing of such a tax, and the extent to which it would be compliant with WTO rules, are not at all clear but promise to be key issues over the next several years (Aylor et al., 2020).
4. Value chain impacts on the role of gas in Europe and the options for exporters
Fragmentation of the gas value chain has substantially complicated the task of the European gas community to cooperate in the decarbonization of gas markets. Liberalization divided the gas value chain into different segments, and regulation requires the network and supply functions of the industry to be operated (and often owned) by different companies. The different segments of the liberalized value chain therefore have different commercial interests:
- • producers and exporters want to sell large quantities of methane — which has required significant investments to discover and develop — over long time periods (if possible) underpinned by long-term contracts;
- • network companies want to maximize the life and the capacity of their assets by transporting products, currently methane but in the future potentially biomethane or hydrogen;
- • suppliers and traders which have power and other energy-related businesses have the option of switching from gas to power, and are therefore not bound to a long-term future of methane or other gas except to the extent that they are owned by producers and exporters;
- • owners of gas-fired power stations, LNG regasification terminals, and gas storages will seek to maximize the productive life of their assets which are shorter than those of networks, although power plants and storages have the potential to use decarbonized gases. But regasification assets are often owned by producers and exporters.
4.1. Exporters of pipeline gas and LNG to Europe
As stated above, exporters of pipeline gas and LNG to Europe have good expectations of growth in the need for additional supply (despite the fact that demand may be flat or falling) over the next decade due to the likelihood that domestic production will fall faster than demand. However, anticipation that serious demand decline could start by the late 2020s and intensify significantly thereafter, raises questions regarding how long, beyond the mid-2030s, it will be possible to sell large volumes of unabated methane in major European gas markets. While the mid-2030s may seem a very long commercial time horizon, it is short in terms of the arrangements required for large-scale decarbonization of methane delivered through via pipelines or LNG projects. And it is certainly not a long time-horizon to ensure that networks and customers will be ready to receive decarbonized gas.
By the 2030s, most European domestic gas reserves — with the exception of Norway — will have been depleted. Therefore it is pipeline gas and LNG exporters, and those who own the networks which deliver their gas, which have the greatest interest in a methane-specific future post-2030. Large pipeline gas and LNG projects are designed to run for more than two decades, and developers of projects, particularly those which have yet to take a final investment decision (and therefore will not start operating until the second half of the 2020s), will need to consider the extent of European demand for unabated methane in the 2030s. The entire gas value chain will need to consider the possibility that national governments may specify targets — and potentially deadlines — for the phasing out of unabated methane (similar to the plans in many EU countries to phase out coal by the early/mid 2020s).
In the event of a reduction of opportunities for methane sales in Europe, pipeline exporters would need to decarbonize their product or accept that their pipelines will progressively become stranded assets. For Norway this may not be particularly serious. By the mid-2030s Norwegian gas production from resources in existing fields and discoveries may have fallen to around half the level of the late 2010s. While new discoveries are possible, there may be political pressure against their development for climate-related reasons and little commercial incentive given that the last major export pipeline for Norwegian gas to Europe was completed in the mid-2000s (Langeled) and the only subsequent pipeline (Polarled completed in 2018) is relatively small. Another relatively small pipeline (Balticpipe) is under development but the principal investors will be Polish and Danish companies.
By contrast, Russia’s Gazprom has a much larger resource base which could maintain exports at the level of the late 2010s for several decades. Several new large-scale pipelines have been built in the 2010s, and others are in the process of being completed. These pipelines will need to remain operational for 20 years to recover their capital costs. Gazprom’s much larger resource base and relatively recently developed pipeline delivery infrastructure means that it does not have the option (available to Norwegian exporters given their much smaller resource base) to run down its deliveries to Europe, possibly phasing out by 2050. For this reason, Gazprom must address the need to decarbonize its gas deliveries to Europe, starting in the 2030s, by converting natural gas to hydrogen.
In contrast to exporters with geographically fixed pipelines, LNG exporters faced with a requirement to decarbonize their product would have the option of exiting European markets and selling elsewhere in the world. But that possibility is likely to be unattractive for several reasons. European markets are significantly profitable with large creditworthy customer bases and many exporters have invested in LNG liquefaction terminals (and associated production and shipping) and have sales organizations which would be potentially stranded should they decide to give up their European gas business. Furthermore, it can be argued that in order to meet COP21 targets, many other parts of the world will have to consider decarbonizing methane post-2040, and it could be valuable for producers and exporters to gain experience in Europe. LNG exporters need to consider the potentially revolutionary options of reforming regasified methane into hydrogen either at the regasification terminal or at the wellhead and shipping hydrogen and/or ammonia rather than LNG. In both cases, the CO2 would be stored close to where it is produced in depleted fields. For those considering investments in new LNG projects whose principal market is (or could be) Europe post-2030, it is not too early to be considering these options. But all of these options will increase the costs of the delivered costs of the fuel which raises issues of competitiveness with other low/zero carbon energy options.
Logic suggests that the options for methane producers and exporters post-2030 are either reforming with CCS, or progressively exiting Europe. Outside the EU and most other OECD countries, the energy transition imperative is far less advanced in relation to decarbonization; improvement of air quality is much higher on government agendas and natural gas can make a major contribution here. The problem is affordability. Historically low real prices for LNG in 2019 and 2020 will provide a useful guide to import potential particularly in Asian markets.
4.2. Methane emissions and certification of GHG emissions from natural gas
One of the most difficult issues surrounding the compatibility of natural gas and LNG with greenhouse gas reduction is the measurement, in particular, of methane emissions from the gas value chain. A significant literature has evolved on the contribution of methane to greenhouse gas emissions, specifically “fugitive” methane from natural gas operations and (resulting from this) the extent to which coal to gas switching should be considered beneficial in terms of overall emissions.
Public domain literature uses generalized leakage factors for natural gas and LNG, usually from the US where most of the publicly available data and estimates originate. Much of the public literature on natural gas emissions — both methane and carbon dioxide — takes a figure, usually from a survey of several US sources extended to a national figure through modelling, and then generalizes the figure worldwide. High emission figures provoke protests from natural gas stakeholders who cite lower figures from other studies and corporate commitments and initiatives which have been undertaken — including OGCI, Methane Guiding Principles, Oil and Gas Methane Partnership, Collaboratory to Advance Methane Science (CAMS), Marcogaz/GIE and ONE Future — to reduce (particularly) methane leakage and promote carbon capture and storage (CCS).
Because high methane emissions threaten the claim of gases to be a beneficial energy transition pathway, certification will be the only way to achieve credibility of emissions’ estimates from the different elements of individual value chains. The emissions needing to be certified will be:
- • domestic gas value chains from wellhead to customer
- • pipeline exports from wellhead to border;
- • LNG exports from wellhead to regasification terminal, including emissions from specific ships per kilometer travelled to market.
Acceptance of the need for certification and the methodology of estimation will be key issues. Like fossil fuel reserves, methane emissions will need to be certified by a recognized company or government/regulatory agency. Some exporters may be unwilling to submit to external certification of emissions, insisting on national estimates which may not be acceptable to stakeholders in importing countries. There are methodological issues in relation to which measurement of emissions — ground or atmospheric levels or some combination of the two — is the most accurate (Balcombe et al., 2015, pp. 16–17; IEA, 2017, pp. 403–404, 409–410). Certification may not be straightforward, particularly where the source of gas production, and transportation assets cannot be attributed to a specific project. But stakeholders should expect to provide certified emissions data from individual elements of pipeline and LNG value chains. The EU Methane Strategy, published in October 2020, sets out a framework for measurement, reporting and verification of emissions.
Achieving credibility for its GHG footprint will require complete transparency of both emissions data and the methodology used to compile them. This may create difficulties for an industry where data confidentiality has been standard operating procedure but is regarded by many in the environmental and academic community as a way to hide high levels of emissions and “greenwash.” Very high and generalized emission claims from environmental and academic groups, referred to above, which receive wide publicity in the media, can only be countered by certified emissions from organizations with proven data-gathering capability and impeccable independence credentials.
5. Summary and conclusions
The role of gases in the energy transition is a different, and much more immediate, issue in the EU, compared with other regions. Under COP21 all governments have specific carbon reduction commitments, but individual EU governments — and it appears the EU as a whole — have committed to net zero emissions by (and possibly even before) 2050. In a context of drastic emission reductions, the advocacy narrative adopted by the gas community which focused on coal to gas switching and backing up renewables with gas, while logical, failed to convince governments, NGOs, and media commentators that it could achieve longer term decarbonization targets.
In order to retain the market and the extensive network infrastructure which has been developed in Europe, zero carbon gases (biomethane and hydrogen) will need to be developed, and natural gas (methane) will need to be decarbonized, on a far more rapid timetable than was previously envisaged. Maximum availability of biomethane and hydrogen from power to gas is estimated at 100–150 bcm by 2050 (or around 25–30% of gas demand in the late 2010s). Therefore, large scale hydrogen production from reformed methane with carbon capture and storage (CCS), or pyrolysis, will be needed to maintain anything close to current demand levels. Costs of biomethane and hydrogen options are several times higher than prices of natural gas in the late 2010s and none have yet been developed on a large scale. Significant financial support for decarbonization technologies — from governments and regulators — will be needed in the 2020s, if they are to be available on a large scale in the 2030s.
These developments will have different impacts on the different parts of the value chain. Pipeline gas suppliers will need to progressively decarbonize their product if it is to remain saleable. LNG suppliers have the option of abandoning European markets in favor of those importing regions where decarbonization policies are yet to have a major impact. However, networks face a potentially existential threat unless they can adapt to a decarbonized product, or their regulatory frameworks are adjusted to maintain profitability at much lower output levels.
If the EU gas community fails to advance convincing decarbonized narratives backed by investments which allow for commercialization of renewable gas and methane decarbonization technologies; and/or governments fail to create the necessary legal/fiscal and regulatory frameworks to support these technologies, then energy markets will progressively move away from gases and towards electrification.
Outside the EU and other countries with aggressive decarbonization targets, the timescale for carbon reduction is longer and air quality is higher on government agendas. Switching from other fossil fuels to natural gas can make a major contribution to air quality improvement, particularly in large Asian cities — the principal region where energy and gas demand is projected to increase rapidly — if delivered prices of LNG remain at 2019/20 levels. But although fuel switching can have a 10–15 year impact on gas demand and emission reductions, the development of decarbonized gases will determine the future of this source of energy in an energy transition of several decades.
References
- Abrahams, L. S., Samaras, C., Griffin, M. W., & Matthews, H. S. (2015) . Life cycle greenhouse gas emissions from U.S. liquefied natural gas exports: Implications for end users. Environmental Science and Technology, 49(5), 3237–3245. https://doi.org/10.1021/es505617p
- Alvarez, A. R. et al. (2018) . Assessment of methane emissions from the U.S. oil and gas supply chain. Science, 361(6398), pp. 186–188. http://doi.org/10.1126/science.aar7204
- Aylor, B., Gilbert, M., Lang, N., McAdoo, M., Öberg, J., Pieper, C., Sudmeijer, B., & Voigt (2020) . How an EU carbon border tax could jolt world trade. Boston Consulting Group, June 30. https://www.bcg.com/en-gb/publications/2020/how-an-eu-carbon-border-tax-could-jolt-world-trade
- Balcombe, P., Anderson, K., Spiers, J., Brandon, N., & Hawkes (2015) , Methane and CO2 emissions from the natural gas supply chain: An evidence assessment (White Paper 1). Sustainable Gas Institute and Imperial College London.
- Barnes, A., & Yafimava (2020) . EU hydrogen vision: Regulatory opportunities and challenges, OIES Energy Insight, No. 73. Oxford: Oxford Institute for Energy Studies.
- Bioenergy Europe (2019) . Bioenergy Europe statistical report 2019. Brussels.
- Biz Brunei (2019) . World’s first global hydrogen supply project begins shipment from Brunei to Japan. December 2. https://www.bizbrunei.com/2019/12/worlds-first-global-hydrogen-supply-project-begins-shipment-from-brunei-to-japan/
- BP (2019) . BP energy outlook 2019 edition. BP p.l.c.
- Catuti, M., Egenhofer, C., & Elkerbout (2019) . The future of gas in Europe: Review of recent studies on the future of gas. CEPS Research Report, No 2019/03.
- Climate and Clean Air Coalition (2018) . Oil and gas methane partnership: Third-year report.
- DNV GL (2018) . Energy transition outlook — The role of gas in a greener Europe. 19th European Gas Conference, 29–30 May, Oslo.
- EC (2018) . In-depth analysis in support of the Commission Communication COM(2018) 773: A clean planet for all. A European long-term strategic vision for a prosperous, modern, competitive and climate neutral economy. Brussels: European Commission.
- EC (2020) . A hydrogen strategy for a climate-neutral Europe. COM(2020) 301 final. Brussels: European Commission.
- European Council (2020) . Special meeting of the European Council (July 17, 18, 19, 20 and 21) — Conclusions. EUCO 10/20, CO EUR 8, CONCL 4. Brussels.
- ENTSO-E & ENTSOG (2019) . TYNDP 2020 scenario report. Brussels: European Network of Transmission System Operators for Electricity and European Network of Transmission System Operators for Gas.
- (2019) . Energy perspectives 2019: Long-term macro and market outlook. Stavanger: Equinor ASA.
- GIE & Marcogaz (2019) . Potential ways the gas industry can contribute to the reduction of methane emissions. Report for the Madrid Forum (5–6 June 2019).
- Hall, M. (2018) . Norwegian gas exports: Assessment of resources and supply to 2035. OIES Paper, No. NG 127. Oxford: Oxford Institute for Energy Studies.
- Howarth, R. W. (2019) . Ideas and perspectives: Is shale gas a major driver of recent increase in global atmospheric methane?. Biogeosciences, 16, 3033–3046. https://doi.org/10.5194/bg-16-3033-2019.
- IEA (2017) . World Energy Outlook 2017. Paris: International Energy Agency.
- IEA (2018) . World Energy Outlook 2018. Paris: International Energy Agency.
- IEA (2019) . World Energy Outlook 2019. Paris: International Energy Agency.
- Lambert, M., & Oluleye (2019) . A mountain to climb? Tracking progress in scaling up renewable gas production in Europe. OIES Paper, No. NG 153. Oxford: Oxford Institute for Energy Studies. https://doi.org/10.26889/9781784671471
- LeFevre, C. (2017) . Methane emissions: From blind spot to spotlight. OIES Paper, No. 122. Oxford: Oxford Institute for Energy Studies.
- Nace, T., Plant, L., & Browning (2019) . The new gas boom: Tracking global LNG infrastructure. Global Energy Monitor, June.
- Pöyry (2019) . Hydrogen from natural gas — The key to deep decarbonisation. Pöyry Management Consulting
- (2018) . Shell scenarios. Sky: Meeting the goals of the Paris Agreement. https://www.shell.com/energy-and-innovation/the-energy-future/scenarios/shell-scenario-sky.html
- Stern, J. (2019a) . Narratives for natural gas in decarbonising European energy markets. OIES Paper, No. NG 141. Oxford: Oxford Institute for Energy Studies. https://doi.org/10.26889/9781784671280
- Stern, J. (2019b) . Challenges to the Future of LNG: Decarbonisation, affordability and profitability. OIES Paper, No. NG 152. Oxford: Oxford Institute for Energy Studies. https://doi.org/10.26889/9781784671464
- Thinkstep (2019) . Lifecycle GHG emission study on the use of LNG as marine fuel. https://sea-lng.org/wp-content/uploads/2020/06/19-04-10_ts-SEA-LNG-and-SGMF-GHG-Analysis-of-LNG_Full_Report_v1.0.pdf
- Wang, A., van der Leun, K., Peters, D., & Buseman (2020) . European hydrogen backbone: How a dedicated hydrogen infrastructure can be created. Utrecht: Guidehouse.
1 * E-mail address: jonathan.stern@oxfordenergy.org<br/> Parts of this paper are drawn from the author’s Oxford Institute for Energy Studies publications Stern (2019a, 2019b).<br/> © 2020 Non-profit partnership “Voprosy Ekonomiki.” This is an open access article distributed under the terms of the Attribution-NonCommercial-NoDerivatives 4.0 (CC BY-NC-ND 4.0).
2 EU data in this paper includes the UK despite the country’s departure from the Union in 2020.
3 The COP 21 target limits warming to well below 2 degrees C (3.6 degrees F) above pre-industrial levels and to try to limit the temperature increase to 1.5 degrees C.
4 Net zero means carbon neutrality: achieving net zero carbon dioxide emissions by balancing carbon emissions with carbon removal (often through carbon offsetting) or simply eliminating carbon emissions altogether.
5 Note that data in Fig. 2 are in tonnes of oil equivalent converted at 1 toe = 1.22 bcm.
6 At the end of 2019, 18 countries had made some form of commitment to carbon neutrality. 2 countries had achieved it; 4 had made this a legal requirement and a further 2 had proposed legislation; 8 had policy documents which included the target, and in a further 4 the target was under discussion. Ten of these countries were EU member states including the substantial gas markets of: UK, France, Germany and Spain. None of the 18 countries are in Asia (Energy and Climate Intelligence Unit, Net Zero Emissions Race: 2019 Scorecard, https://eciu.net/briefings/net-zero/net-zero-the-scorecard).
7 The non-European countries which had achieved or made legal or policy commitments to carbon neutrality were: Bhutan, Suriname, Chile, New Zealand, Costa Rica, Fiji and Marshall Islands’; none of which have substantial energy demand or carbon emissions (https://eciu.net/briefings/net-zero/net-zero-the-scorecard).
8 For discussion of these differences see Stern (2019a, p. 9).
9 Synthetic natural gas (SNG) can be produced from gasification of waste via a thermo-chemical process using biomass and/or other waste as a feedstock. This technology is still at an early stage of development.
10 The exception is the hydrogen scenario in Fig. 2 which has a demand of 150 bcm in 2050.
11 The IEA (2018, pp. 507–508) estimates that around 50% of global hydrogen production is generated from natural gas by steam methane reforming, 30% from cracking oil products (mainly naphtha) in the refining and chemical sectors, and 18% using coal gasification (mainly in China).
12 More information on the commercial issues connected with Pyrolysis can be found in Pöyry (2019).
13 This paper uses European Commission (2020, pp. 3–4) terminology from its Hydrogen Strategy which is that “renewable gas” means gas from renewable electricity, biogas or biochemical conversion of biomass. “Decarbonized gas” (also known as low-carbon or fossil based gas) means gas derived from fossil gas (with carbon capture).
14 See Pöyry (2019) for Pyrolysis costs.
15 IEA (2019, p. 183, Table 4.3) estimates that EU gas production will fall from 120 bcm in 2018 to 40–47 bcm in the 2030s.
16 Hall (2018) citing Norwegian Petroleum Directorate data, Fig. 4, p. 6.
17 Notably Nord Stream 1 and 2, and Turkstream 1 and 2, as well as investment in onshore extensions of some of these pipelines. Novatek also has a very large resource base from which LNG is being exported to Europe and globally.
18 Shipping hydrogen is more complex than LNG as it requires cooling to –253°C (significantly lower than –162°C for LNG). The shipments of hydrogen from Brunei to Tokyo started in December 2019 but the delay to the Olympic Games (where the Village is to be powered by hydrogen) has slowed the intended schedule (Biz Brunei, 2019; Stern, 2019b, pp. 16–17).
19 For natural gas and LNG affordability issues outside Europe see Stern (2019b, pp. 18–29).
20 In addition, there is uncertainty about the figure which should be adopted for radiative forcing of methane and over what time period: the IEA uses figures of 85 over 20 years and 30 over 100 years (IEA, 2018, Box 11.3, p. 490). But estimates for the 20-year time frame can be as high as 87 and for 100 years up to 36 (IEA, 2017, Box 10.2, p. 405; Balcombe et al., 2015, p. 16; Stern, 2019a, Appendix A; LeFevre, 2017).
21 An example of this is Nace et al. (2019) which uses emission factors from Alvarez et al. (2018). See also Abrahams et al. (2015). For US studies using both top-down and bottom-up methodology see IEA (2017, pp. 403–413). The most complete study of the methane emissions literature up to 2015 is Balcombe et al. (2015). A 2019 US study suggests that North American shale gas production “may have contributed more than half of all of the increased emissions from fossil fuels globally and approximately one third of the total increased emissions from all sources globally over the past decade” (Howarth, 2019).
22 Oil and Gas Climate Initiative (OGCI), http://oilandgasclimateinitiative.com/; Methane Guiding Principles, http://ccacoalition.org/en/resources/reducing-methane-emissions-across-natural-gas-value-chain-guiding-principles; Collaboratory to Advance Methane Science (CAMS), https://methanecollaboratory.com/; GIE and Marcogaz (2019); ONE Future, http://onefuture.us/. LNG export assets are included in the facilities being surveyed for emission reduction, Climate and Clean Air Coalition (2018, p. 12)
23 Similar requirements should (and probably will eventually) apply to all fossil fuels and the intention is not to single out gas and LNG to the exclusion of other fossil sources which could have similar or higher emissions. But given the likely increase in particularly LNG imports from remote sources, documentation of emissions is likely to become important in a shorter time frame.
24 For example, where the gas may be coming from different (oil or) gas wells with different characteristics and where there could be different pipeline routes to an LNG terminal; this might be particularly applicable in the US. Thinkstep (2019, Annex D), provides detail by country for energy use and gas losses from conventional and unconventional gas production, processing and transportation to liquefaction plants in: Algeria, Australia, Indonesia, Malaysia, Nigeria, Norway, Qatar, Trinidad and Tobago, and the USA.