


Recent Evolution of European and Asian Prices and Implications For the LNG Market
The first act, which stretched till the beginning of October 2018, saw incremental LNG supply volumes being almost entirely absorbed by Asian countries. Asian prices in winter 2017/18 spiked to over $10 per million British thermal units (mmBtu) due to the unexpectedly high LNG demand in China, as industrial and residential users switched from coal to gas. Thereafter, in summer 2018, Asian and European spot prices surprised by increasing in a counter-seasonal way, to above $10/mmBtu and $7.5/mmBtu respectively, on the back of tight LNG markets; they were also supported by higher oil, coal, and carbon prices.
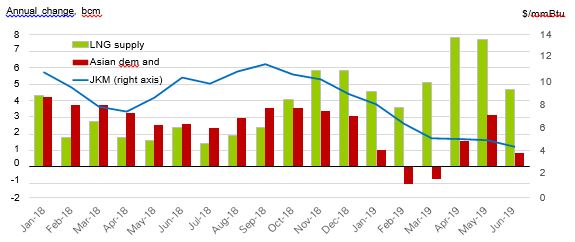
The second act started in October 2018. The move from one act to another was particularly visible through the evolution of additional LNG supply, compared to incremental LNG demand in Asia. During 2018, the latter exceeded incremental LNG supply almost every month until October, when the trend reversed. From then on, incremental LNG supply increased to much higher levels—up to 8 billion cubic metres (bcm) per month—as new plants started operating or ramped up in Australia, Russia, and the United States; meanwhile, LNG demand growth in Asia weakened under the combined pressure of warmer weather and nuclear power plant restarts in Japan. The weakness in Asian demand was compounded by a much lower Middle East and North African LNG demand. Consequently, JKM and NBP prices have continuously dropped since then, and at the time of writing (August 2019), they had reached $4.4/mmBtu and $3.4/mmBtu, respectively, less than half their level a year before.
|
Advertisement: The National Gas Company of Trinidad and Tobago Limited (NGC) NGC’s HSSE strategy is reflective and supportive of the organisational vision to become a leader in the global energy business. |
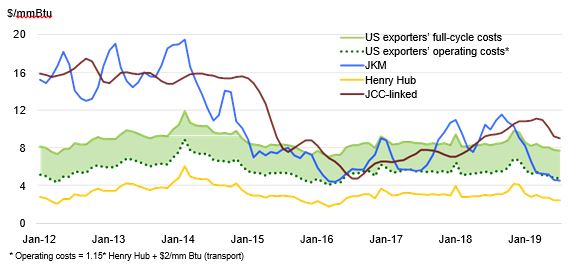
The results of that double whammy were two tangible signs of oversupply: a sharp price drop, well below the oil-linked gas prices and down to around the level of estimates of US LNG exporters’ operating costs (about $3.5/mmBtu in Europe in August 2019); and surplus LNG cargoes being diverted to Europe. The significance of the latter is that the region acts as the residual market: it is the only market capable of absorbing surplus LNG volumes thanks to its significant regasification capacity, third- party access, and spot market prices.
Incremental LNG supply vs incremental Asian demand and JKM prices
Europe’s LNG imports increased to above 8 million tonnes in March and April 2019 (over 11 bcm per month), the highest levels ever recorded in this region and more than twice the levels observed during the same period in 2018. This happened in a context of high Russian pipeline gas flows to Europe and high levels of storage. Consequently, European gas prices sank to below the coal-switching parity level, creating additional gas demand in the power sector. US LNG exporters’ operating costs effectively act as a floor to European prices, below which US LNG capacity will begin to be less than fully utilized or even shut in. If, as seems likely, the capacity of European markets to absorb high volumes of LNG and Russian pipeline gas over the coming months diminishes as storage levels are replenished, something will have to give.
What are the implications of the current LNG oversupply for global LNG markets and prices?
First, based on current trends it seems likely that this oversupply will continue for another couple of years, and that Asian and European gas spot prices will be depressed until markets tighten again. Many things can influence the length and size of that oversupply, including global economic growth, other commodity prices, and of course weather, which had a tremendous influence on 2018 energy demand. But as large additions of new LNG supply are expected in both 2019 and 2020, the die is cast: it is unlikely that Asia will be able to absorb it all. China, which is the driving force behind LNG demand growth and which absorbed 37 bcm over the past two years, may see slower gas demand growth going forward and will start importing Russian pipeline gas near the end of 2019, dampening LNG imports growth thereafter.
JKM vs oil-linked gas prices and US LNG exporters costs
Second, JKM and oil-linked contract prices have diverged. While there is a lot of attention to JKM, most LNG in Asia today is still sold based on oil-indexed contracts, typically linked to the Japanese Crude Cocktail (JCC). Japan and China prices have largely followed oil indexation (JCC), not JKM. The lower levels of China LNG prices before 2015 were due to initial LNG contract pricing at fixed low levels.
JKM vs oil-linked gas prices, China and Japan average LNG import prices
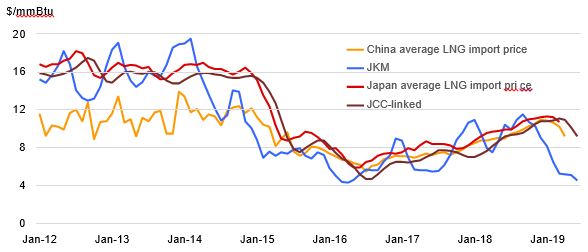
Over the past few years, JKM prices have broadly followed the trend set by oil-linked contract prices. This is more obvious when comparing the annual average of JKM to that of the oil-linked gas price, removing the seasonal pattern. There is a 96 per cent correlation between the two prices, the only notable divergence being in 2015 when Asian LNG demand dropped and oil prices collapsed.
In the case of a relatively balanced market, like in 2017, JKM featured the typical seasonal pattern of the northeast Asian regions, hovering around the oil-linked gas price. Periods of tightness—like winter 2017/18, when China’s LNG demand increased markedly—were translated into JKM at a premium. At times, JKM has also been at significant discounts to oil-linked gas prices: that was the case over 2014–15, as Asian LNG demand abruptly slowed and even dropped for the first time since the economic crisis in 2009. As LNG oversupply started in late 2018, a gap between JKM and the oil-linked gas price started to emerge. As of July 2019, this gap reached around $4.5/mmBtu, the same level as JKM itself. That would incentivize Asian buyers to nominate less LNG under their long-term contracts and seek LNG volumes sold at JKM spot prices.
Third, this begs the question of whether Asian buyers will move away from oil indexation. Indeed, this sort of divergence in Europe in 2009-10, due to the economic crisis and the previous LNG supply wave, resulted in many European buyers renegotiating their long-term contracts with their suppliers. A large number moved away from oil indexation towards spot indexation. Consequently, the share of oil indexation in Europe declined from about 80 per cent in 2005 to around 60 per cent in 2010 and down to 25 per cent in 2018, according to the International Gas Union.
However, it is unsure whether Asian buyers are ready to move fully to JKM as an index in long-term contracts, even though JKM LNG swap volumes traded on the Intercontinental Exchange and Chicago Mercantile Exchange have surged over the past two years. JKM is a price assessment, but not a fully traded price such as NBP and TTF (Title Transfer Facility). When the move away from oil indexation took place in Europe, NBP and TTF were already liquid trading hubs. Despite the significant progress made by China, Japan, and Singapore in terms of market opening and liberalization supporting the creation of their own hubs, nothing as liquid as NBP or TTF exists yet. Only a couple of preliminary LNG offtake agreements using JKM as a benchmark have been signed so far, notably between Tellurian and offtakers such as Total and Vitol. Some buyers and sellers may be ready to include JKM in term contracts within a pricing basket mixing different indexations. Still, JKM is widely considered the Asian LNG spot price benchmark, even if this is not a traded price. Looking forward, the fact that recent contracts signed by portfolio players do not yet have a fixed destination makes it possible that some of these volumes are sold at JKM prices, further enhancing LNG commoditization.
An additional consequence of the oversupply is that buyers are taking advantage of the current market weakness by pushing for more favourable pricing conditions. Buyers may want to opt for one or a mix of indexations, including oil indexation, JKM, and/or various other spot indexations, providing hedging against various risks.
Oil indexation itself is multifaceted, and recent contracts have tended to have lower slopes, down to 11 per cent instead of the usual 14–15 per cent. At oil prices around $50/barrel, this can yield a price $1.5–2.0/mmBtu lower.
Attempts are still being made to index long-term LNG contracts to other commodities. In early 2019, Shell and Tokyo Gas signed an LNG contract indexed to coal. While this indexes gas to another commodity for which price movements are not related to the gas market, it correctly identifies the main competitor of natural gas in the power market: coal, no longer oil. In Asia, gas represents 12 per cent of power generation, compared to almost 60 per cent for coal in 2018 (around 25 per cent and 50 per cent respectively if one excludes China).1 Coal-fired generation in Europe was also higher than gas-fired generation in 2018. The relationship between coal, gas, and carbon prices in Europe impacts their respective moves: low gas prices are currently incentivizing additional gas demand in the power sector as they drop below the coal-switching level.
For those looking at US LNG supplies, formulas are changing too: liquefaction fees proposed in most recent projects such as Calcasieu LNG are lower than the $3.0–3.5/mmBtu observed in the first wave of US LNG. Tellurian is reported to have a totally different approach to the tolling fee, having project partners investing in equity in an integrated project and getting low-cost LNG in return. Finally, US producer Apache is said to have signed a deal to supply Cheniere using a price mechanism linked to JKM. This signals the interest of US producers to be exposed to global LNG prices, especially Asian spot prices, and reinforces JKM as a credible benchmark for Asia. Finally, the cost-plus approach that US LNG has initiated highlights an important, though often simplified, component of the price: shipping costs. This matters in determining not only the final price in various markets, but also the differential between European and Asian markets, and therefore the attractiveness of each market to US LNG exporters and re-export patterns.
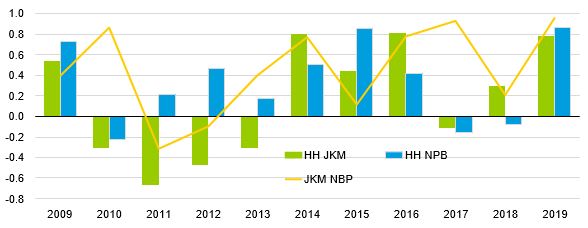
Finally, will there be more convergence between regional spot prices? Over the past few years, there has been much talk about a growing convergence between Asian, European, and US spot prices. Looking at the correlation between monthly Henry Hub, JKM, and NBP prices on an annual basis, the correlation between NBP and JKM has increased over time, reflecting these markets’ competition for LNG imports. Given that the US only started exporting LNG in 2016 and imports negligible amounts, low correlations over 2010–13 at a time of high oil prices are perfectly understandable. In 2018, the correlation of NBP and JKM with Henry Hub was especially hampered by Henry Hub increasing in the last quarter of 2018, while NBP and JKM started to tumble. But as we have moved into oversupply, the correlation between the three prices has dramatically increased.
Correlation between JKM, Henry Hub, and NBP prices
The final question is: when and if LNG moves to commoditization (by being priced against its own fundamentals), what will drive the various regional gas prices, and will there be an increased correlation between gas prices? BP projects2 that the United States will be a leading LNG exporter by 2040, making it quite likely that prices will eventually be set by the liquefaction and transport differentials to the United States. But the path towards that stage could be a lengthy one, as buyers currently seek different formulas and approaches. As the number of buyers and sellers increases, there is not yet a predominant pattern in terms of what buyers want—in prices but also flexibility—and what sellers are willing to accept.
The statements, opinions and data contained in the content published in Global Gas Perspectives are solely those of the individual authors and contributors and not of the publisher and the editor(s) of Natural Gas World.