Oil, trade and debt: where will the next crisis come from? [GGP]
Oil, trade and debt: where will the next crisis come from?[1]
Ten years after the Lehman Brothers’ bank collapsed, many are wondering where the next crisis will come from. Bethany McLean, an American journalist known for her pieces on the failure of the US commodities trader Enron and the subprime mortgage crisis some years later, in her latest book “Saudi America”[2] tackles the difficult relationship between the shale industry and debt.
|
Advertisement: The National Gas Company of Trinidad and Tobago Limited (NGC) NGC’s HSSE strategy is reflective and supportive of the organisational vision to become a leader in the global energy business. |
Between 2009 and 2014, the shale industry has been supported not only by high oil prices but also cheap debt. The availability of low interest rates has led to debt surging, as cash flows were not sufficient.
Thanks to shale production, the US flooded the market with about 5mn barrels/day. From the 1970s until 2015 there had been a ban on oil exports, but not on gas or refined products.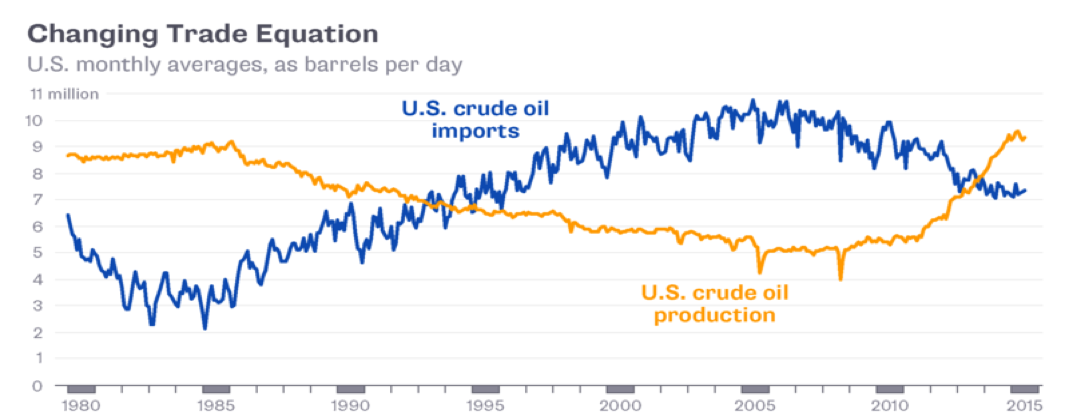
On December 18, 2015, the US oil industry received its Christmas gift: the Spending Bill[3], passed by the Congress and ratified by the president, which enabled the US to return to export. About two weeks later, the oil tanker Theo T from Texas arrived in the French port Marseilles; the owner of the cargo was the oil trading company Vitol.
If oil export had to wait until 2015, things were different for gas. Natural gas needed only the Department of Energy’s (DOE) approval, not that of Congress. The first LNG plant was built by Cheniere Energy close to the borders between Texas and Louisiana. Another trick to bypass the ban was the reclassification of gas condensates as refined products.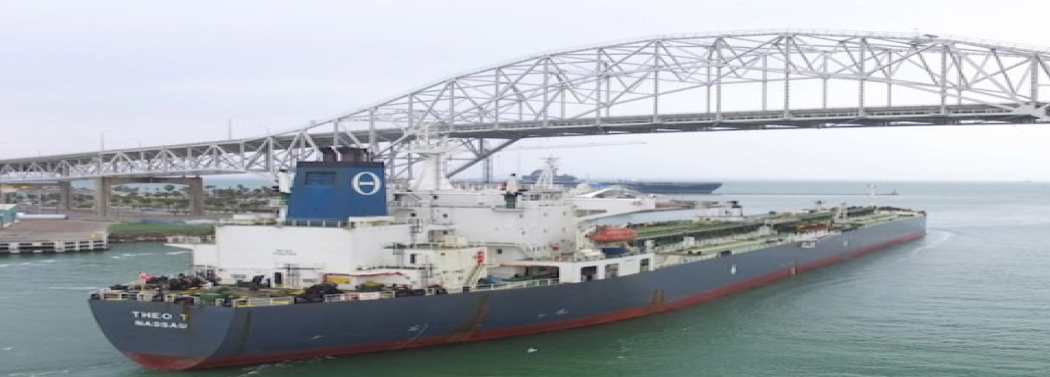
In addition, being very light oil, the US product competed for the same refineries that treated Algerian, Nigerian, Angolan and Libyan crude: another crude was on the market, an alternative in case of supply disruption and high price differentials. Not good news for oil producers from emerging markets, already under pressure from the stronger dollar. US oil also began to arrive in China, reaching $10bn in a short time.
On the domestic front, benefits were also considerable. Low-cost gas created a competitive advantage and boosted growth: since 2010, around 300 gas-related projects have been approved with a total investment value of $181bn.
From an economic risk to a geopolitical risk.
Oil is the perfect mechanism to turn an economic risk into a geopolitical one[4]. Let's take a short tour of the world passing through the four warmest fronts.
We have the Syrian game – or reducing the influence of Iran, affecting about 1mn b/d that could move on to the market. China plays an important role here as importer of Iranian oil, as it has so far refused to cut back its imports despite warnings from Washington. Given its ability to move oil on to the market, China can exert influence on price dynamics and consequently on the shale oil industry.
China then plays the North Korean game with the US; here is also Russia, but in second place.
Then we have the US-China Trade War, which can slow down the global economy and consequently have a knock-on effect on the oil price (Figure 3). When it comes to price expectations, US, Russia, and Saudi Arabia are on the same side.
Finally, we have the game of the South China Sea between the US and China, which about 40% of the world trade transits; here, we are talking about the control of seas and trade. Geopolitics is a growing factor of interest affecting also price dynamics.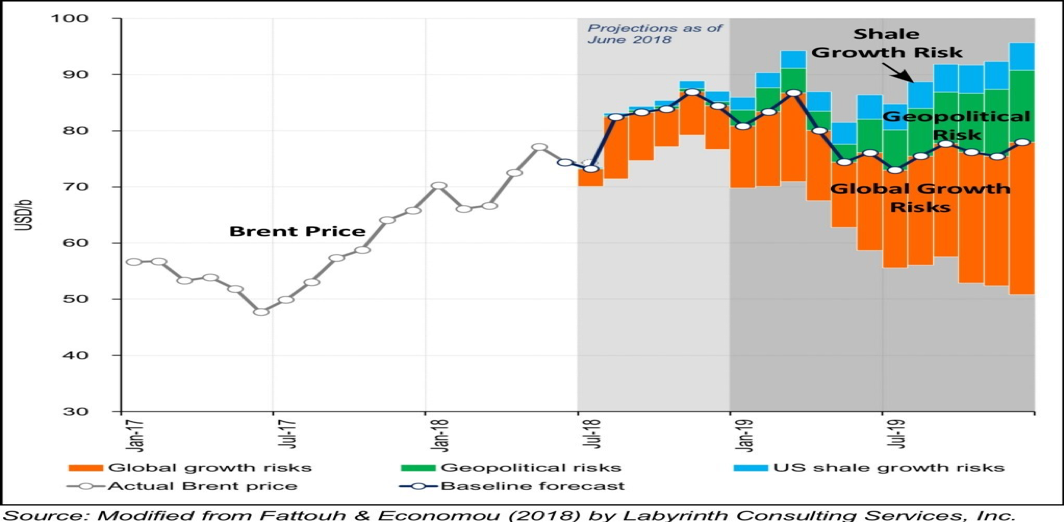
This Rock will change the world.
We have said that the shale boom was driven by a fabulous financial condition: after the 2008 crisis and the beginning of the Federal Reserve’s Quantitative Easing, low rates pushed hedge fund and pension fund managers to seek more lucrative investments: shale companies among those. Now the bonds issued by US oil companies with below BBB investment grade amounted to $70bn in 2017 and will reach $260n in 2022, according to Bloomberg.
Let' s play with numbers. Consider (figure 1) the 5mn b/d from shale at $60/b for 365 days: we have about $110bn in revenues in a year. With these revenues, I have to pay annual debts. The margins are tight; everything depends on price moves: having Iranian oil in the market (see above Iran and China) can make the difference.
McLean in her book tells us the 16 largest public shale companies in 2014 burned $80bn more on buying leases, drilling and hydraulically fracturing wells $80bn more than they had earned. It seems not such a great deal.
In this kind of environment there are two outcomes: Big Oil enters the market and acquires distressed companies, restructures debt and soon reaches production; or there is a consolidation phase among mid-big shale companies to create synergies and economies of scale and push down costs. However, this is to be seen in the long term..png)
The wrong debt
While some have been worried about shale producers and related debt, I am not in that group. Those who are, should consider some points. First of all, the crisis happened because people could not pay loans and bank “securitisation” facilitated credits. This was essentially the process that allowed a kind of contagion from the real estate to the banking sector, thanks to derivatives of one kind or another.
When bank shares suffer, stock market indices are dragged down as banks make up a big portion of the trade each day. Furthermore, real estate has more impact on the economy than oil in terms of GDP: the real estate sector is larger than the mining sector, including oil and gas. In addition, the home is often used for access to credit and therefore is a kind of economic catalyst. In short, it will be hard for oil to replicate the events of 2008.
In August 2018, the Federal Reserve of New York[5] (Figure 5) reported an increase in aggregate debt, surpassing the 2008 level of about $618bn, reaching a total of $12.68 trillion. The debts related to mortgages were about $9 trillion. We also see the growing trend since 2008 for student loan and cars.
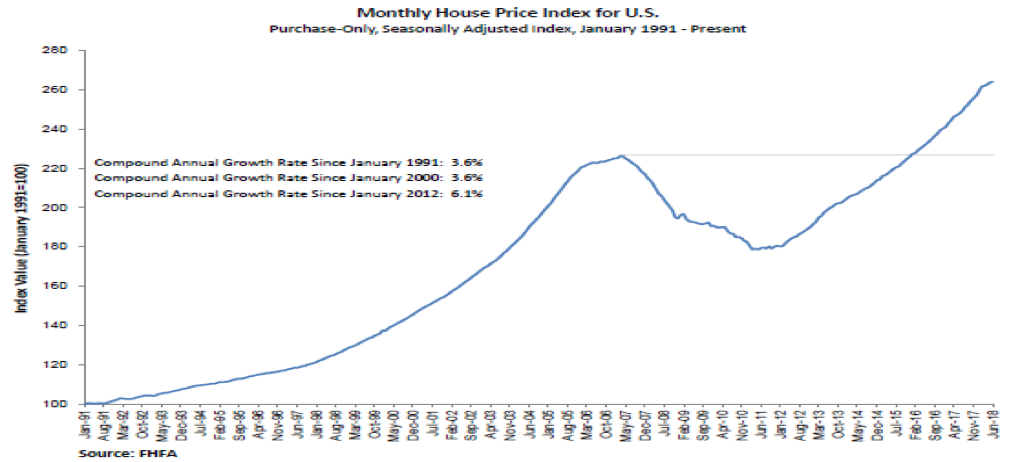
Here we note that young Americans are getting into debt to study and buy a car. Are we sure that with all this debt already around their necks that they will want also to buy a house, especially as house prices are rising?
The original was previously published on StarMagazine here.
The statements, opinions and data contained in the content published in Global Gas Perspectives are solely those of the individual authors and contributors and not of the publisher and the editor(s) of Natural Gas World
[1] Italian version previously published on StarMagazine here: https://www.startmag.it/mondo/petrolio-commercio-e-debito-da-dove-verra-la-prossima-crisi/
[2] “Saudi America: The Truth About Fracking and How It’s Changing the World”
[3] https://www.bloomberg.com/quicktake/u-s-crude-oil-export-ban
[4] https://www.brookings.edu/research/fueling-a-new-order-the-new-geopolitical-and-security-consequences-of-energy/
[5] https://www.fhfa.gov/AboutUs/Reports/Pages/US-House-Price-Index-Report-2Q-2018.aspx


