

[NGW Magazine] Renewables forge ahead
REN21 produced GSR-2018, a highly comprehensive overview of the state of the global renewable energy, recent developments and trends in renewable energy markets, industries, investments and policy developments.
NEO-2018 presents a renewables outlook to 2050, concentrating on technologies that drive change, such as solar PV, onshore and offshore wind and battery technology. In addition, it places special emphasis on changing electricity demand and electric vehicles. It also includes price forecasts for coal, oil and gas, and assesses the impact of the energy transition on fossil fuel demand and materials.
State of global renewable energy
The key conclusions from REN21’s GSR-2018 report are:
- a revolution in the power sector is driving rapid change towards a renewable energy future;
- but the overall transition is not advancing with the speed needed.
Renewables accounted for over 70% of net additions to global power generation capacity in 2017, up 9% on 2016, with solar power additions up 29% on 2016. These were the largest ever.
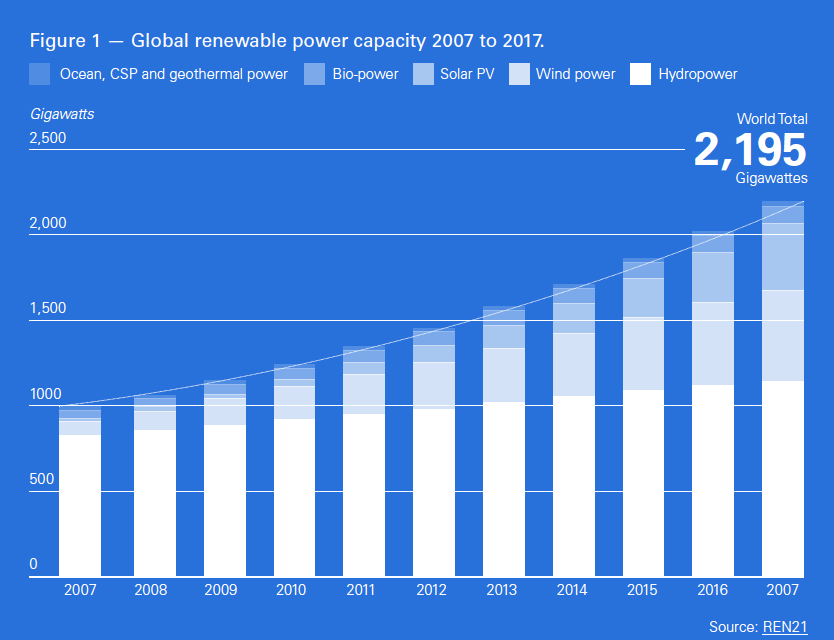
In the ten-year period 2007 to 2017, global renewable power capacity more than doubled, from about 1 TW to close to 2.2 TW (Figure 2). In a positive forward to the report, the chair of REN21, Arthouros Zervos, pointed out that in 2017: “New solar photovoltaic (PV) generating capacity alone was greater than additions in coal, natural gas and nuclear power combined.”
2017 was also record-breaking in terms of falling renewables costs, increases in investment and advances in enabling technologies. Competitive tenders worldwide have been leading to ever-lower bids for renewables power. But it also needs mentioning that renewables require favourable weather: dams need rain, solar panels need sun, and so forth.
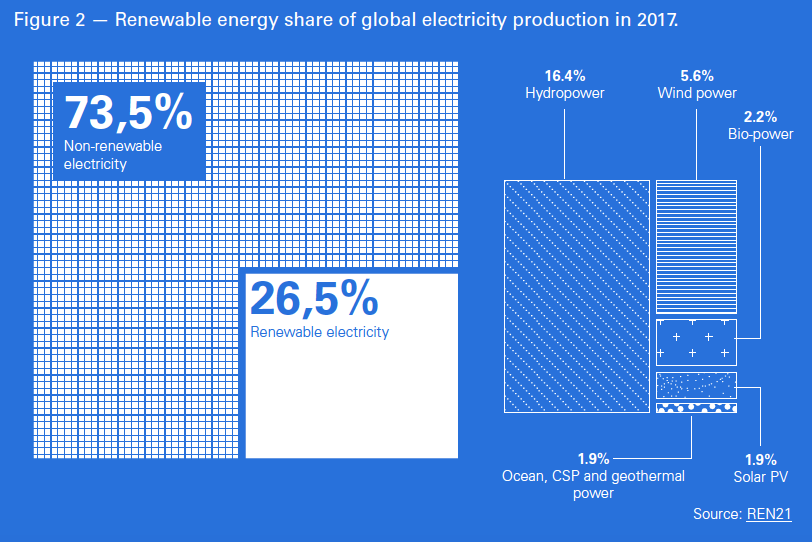
As a result of these, the share of renewables in global electricity production rose to 26.5% in 2017, up 2% on 2016. Of this, the lion’s share was from hydropower with 16.4%, with solar and wind jointly contributing 7.5% (Figure 2).
In 2017, 30% of the European Union’s electricity was generated by renewables – hydro, wind, solar and biomass. Denmark achieved the highest renewable electricity share, with 74%; Germany had 30%. But both also had the highest electricity costs in Europe by far, at about 150% of the EU average for household consumers. Denmark and Germany can perhaps afford this, but it would be a problem for developing countries.
At the end of 2016, renewable energy accounted for about 18.2% of global total final energy consumption (TFEC), with modern renewables, defined in GSR-2018 as all non-fossil fuels excluding nuclear and traditional biomass, representing 10.4%. But the total contribution from wind and solar was still very low, less than 1.7%.
However, a stark conclusion in GSR-2018 is that while momentum in the power sector is positive, it will not on its own deliver the emissions reductions demanded by the Paris climate agreement.
The heating, cooling and transport sectors, which together account for about 80% of global total final energy demand, are lagging behind. This is reflected in national targets (NDCs) for renewable energy. For heating and cooling such targets exist in only 48 countries, and for transport in 42; while 146 countries do have such targets in the power sector.
About 92% of transport energy demand is still being provided by oil. EVs and electrification are offering possibilities, but as of now electricity provides only 1.3% of transport energy needs, with about a quarter of that coming from renewables. For the transport sector to achieve significant change, it needs energy storage systems with low cost, low weight and high energy density, which are still challenges.
An important development in terms of maintaining the momentum of renewables penetration in global energy is that the number of countries with renewable energy targets and support policies increased again in 2017. Several, including the EU, have also made their existing targets more ambitious. As many as 57 countries now have 100% renewable electricity targets.
Another positive developments is that large oil companies more than doubled their number of acquisitions, project investments and venture capital stakes in renewable energy in 2016 relative to 2015.
Energy efficiency
REN21 concludes in GSR-2018 that the importance of energy efficiency is rising up the list of priorities and global energy intensity continues to fall. In addition, the importance of integrating energy efficiency and renewable energy is also recognised.
Trends in energy efficiency are usually assessed by monitoring primary energy intensity, defined as the ratio of gross consumption of energy per unit of GDP. Between 2011 to 2016 it fell by about 10%, at an average yearly rate of 2.1%.
In 2016, global GDP grew 3%, but energy demand rose only 1.1%. In 2017 global GDP growth was 3.7% and the increase in energy demand almost doubled to 2.1%, which was due to economic growth in emerging economies. Progress in energy efficiency is slowing down.
In general, non-OECD countries continue to see energy use rising alongside growing GDP, while OECD countries do not.
REN21 recommends that system integration, and better end-use efficiency, especially in heating and transport, can improve this performance. Improving energy efficiency is key to bringing energy demand and carbon emissions under control.
Carbon pricing
Carbon pricing receives considerable attention in GSR-2018. Carbon pricing policies, if well designed, may incentivise the deployment of renewable energy technologies by making higher-emission fuels and technologies more expensive.
The number of countries worldwide with carbon pricing policies in place stood at 64 by the end of 2017, up from 61 in 2016. As of April 2018, between a quarter and a fifth of global carbon emissions were covered by an explicit carbon price, up from 13% at the end of 2016, mainly thanks to the entry into force of China’s scheme.
The Chinese scheme is the largest in the world and includes carbon taxes, as well as emissions trading among about 1,700 power companies that collectively emit more than 3bn metric tons (mt) of carbon dioxide (CO2)/yr.
For comparison, in 2016, the EU’s Emissions Trading Scheme (EU ETS) covered around 1.7bn mt of CO2. In late 2017 EU members reached agreement on EU ETS reforms to increase the scheme’s impact. These included an agreement to reduce the number of emission certificates and to accelerate the cancellation of surplus certificates.
The ‘Carbon Pricing in the Americas’ initiative, launched in 2017, includes members from north, central and south America and aims to strengthen the implementation of carbon pricing as a central policy instrument in order to advance action on climate change, the shift to ‘clean’ energy, innovation and the promotion of sustainable economic development.
Given that historically carbon pricing has benefited renewable transport fuels and renewable heating and cooling, its wider implementation should benefit those sectors where so far progress in the adoption of renewables is slow.
Global renewables outlook to 2050
In NEO-2018, BNEF forecasts that wind and solar are set to surge to almost 50% of world power generation by 2050 (Figure 3), rising to as much as 87% of electricity in Europe and 55% in the US, based on massive cost reductions and cheaper electricity storage batteries. Solar and wind costs are expected to drop 71% and 58%, respectively between 2017 and 2050.
Introducing NEO-2018, Seb Henbest, BNEF’s head of EMEA, said "The arrival of cheap battery storage will mean that it becomes increasingly possible to finesse the delivery of electricity from wind and solar, so that these technologies can help meet demand even when the wind isn’t blowing and the sun isn’t shining… The result will be renewables eating up more and more of the existing market for coal, gas and nuclear.” NEO-2018 is the first BNEF report to highlight how falling battery costs will transform the electricity mix between now and 2050. But in the short-term soaring costs of cobalt and lithium are posing some challenges.
However, in order to achieve this remarkable renewable growth, the report also assumes, rather optimistically that coal shrinks to just 11% of global electricity generation by 2050. This is at odds with other outlooks, such as BP’s Energy Outlook 2018 according to which fossil fuels will still be providing over 50% of global power generation by 2040, with coal at 28% and gas 23%, while renewables, solar and wind, provide 25%. Coal may effectively disappear from the US energy mix by 2050, but not in Asia – see NGW ‘The myth of coal is dead’ Vol. 2, Issue 12.
In fact global coal consumption increased by about 1% in 2017. In addition, 654 GW new coal-fired plants, each with a life of about 40-yrs, are in development worldwide. It is not just price that is driving this, but also security and reliability of energy supplies.
Similar comments apply to nuclear energy. BNEF forecasts its continuous decline (Figure 3). But with China on the way to become the world’s leading producer of nuclear electricity sometime before 2030 and with nuclear regaining its position in Japan’s new energy plan to 2030, nuclear energy is here to stay. This is supported by BP's and IEA's outlooks.
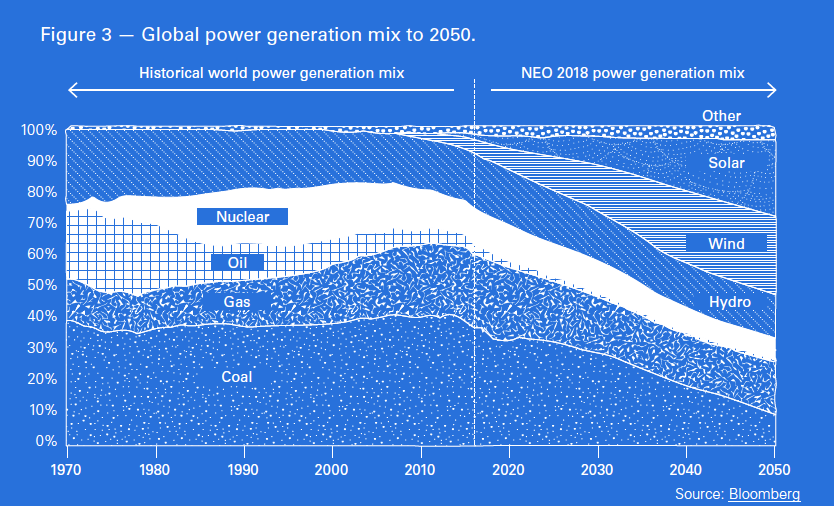
The forecast for natural gas to 2050 in NEO-2018 is mixed. It estimates that $1.3tn will be invested in new gas-fired capacity to 2050, but with half that total invested in peaking plants that provide power mostly during periods of high demand, backing up renewable generation. As a result, even though gas-fired generation capacity is forecast to increase 15% by 2050, the gas share of global electricity production will fall from 21% now to 15% by 2050 (Figure 3). Again, as with coal, this is at odds with other outlooks, such as BP’s which sees the gas share of electricity generation remaining steady at 23% over the same period.
Global primary energy demand growth, including renewables, will be driven by China, India and other developing Asia – these countries, their policies and their actions will be critical to the global energy transition. BNEF estimates that renewables will supply 62% of China’s electricity by 2050 and 75% of India’s.
Provided it happens, BNEF’s forecast that coal consumption will drop dramatically bodes well in terms of emissions, forecast to drop by 38% by 2050. However, Matthias Kimmel, energy economics analyst at BNEF, said: “Even if we decommissioned all the world’s coal plants by 2035, the power sector would still be tracking above a climate-safe trajectory, burning too much unabated gas…. Getting to 2 degrees requires a zero-carbon solution to the seasonal extremes, one that doesn’t involve unabated gas.”
BNEF estimates that a staggering $11.5tn will be invested globally in new power generation capacity from 2018 to 2050, with the majority going towards renewables. About $8.4tn will be spent on wind and solar, and another $1.5 trillion on other zero-carbon technologies such as hydro and nuclear. This is forecast to lead to a seventeen-fold increase in solar PV capacity and a six-fold jump in wind power capacity globally.
Challenges
While these developments appear to be promising, renewables and the broader energy sector face several challenges. Strong global economic growth led to an estimated 2.1% increase in energy demand in 2017 – more than twice the average increase over the previous five years. This contributed to energy-related CO2 emissions rising by 1.4% in 2017 for the first time in four years. In some instances, countries moving away from coal have switched to natural gas rather than to renewables.
Low fossil fuel prices continued to pose a challenge to renewable energy markets during 2017, especially in the heating and transport sectors.
Although renewables continue to gain ground globally, REN-21 concludes that progress is uneven across sectors and regions, with China, Europe and the US accounting for nearly 75% of all global investment in renewables in 2017.
In 2016, modern renewables (not including traditional use of biomass) accounted for 10.4% of TFEC (Figure 4), only a slight increase compared to 2015.The greatest portion of the modern renewable share was renewable electricity, accounting for 5.4% of TFEC, most of which was generated by hydropower, with 3.7%. It was followed by renewable thermal energy, accounting for 4.1% of TFEC, and transport biofuels, with about 0.9%. Traditional use of biomass, primarily for cooking and heating in developing countries, accounted for an additional 7.8%. Combined renewable energy accounted for an estimated 18.2% of TFEC, with fossil fuels providing 79.5% and nuclear energy 2.2% (Figure 4).
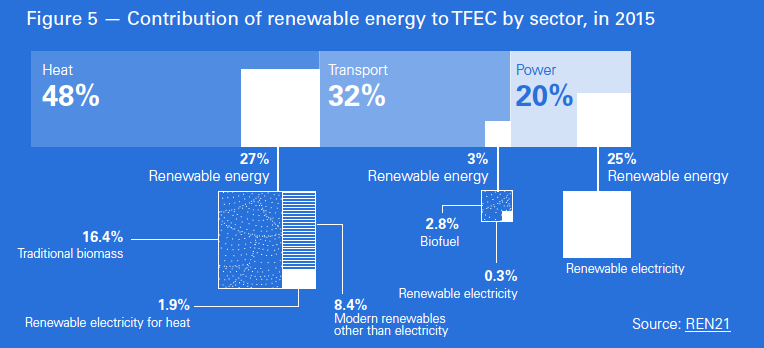
.png) GSR-2018 observes that the overall share of renewable energy in TFEC has increased only modestly in recent years, despite tremendous growth in some renewable sectors. Progress in the renewable heating and cooling and transport sectors continues to be relatively slow (Figure 5), despite a number of initiatives to boost the role of renewables and electrification of these sectors. Change needs to be driven by new policies and more innovation.
GSR-2018 observes that the overall share of renewable energy in TFEC has increased only modestly in recent years, despite tremendous growth in some renewable sectors. Progress in the renewable heating and cooling and transport sectors continues to be relatively slow (Figure 5), despite a number of initiatives to boost the role of renewables and electrification of these sectors. Change needs to be driven by new policies and more innovation.
 The executive secretary of REN21, Rana Adib, said: “Equating ‘electricity’ with ‘energy’ is leading to complacency. We may be racing down the pathway towards a 100% renewable electricity future, but when it comes to heating, cooling and transport, we are coasting along as if we had all the time in the world. Sadly, we don’t.”
As a result, renewable energy uptake is not keeping pace with increasing global energy demand and the continuous investment in fossil and nuclear capacity. Renewables are growing fast, but not fast enough.
This is also reflected in the latest report published in August by Carbon Clean200. It concludes that clean energy investments by 200 of the world's leading ‘clean energy’ corporations have underperformed compared to fossil fuel energy stocks over the past year and a half.
This overall performance of renewables is, perhaps, what led Shell CEO Ben van Beurden to say that oil, and gas, are “here to stay as cleaner power lacks sizzle.” This is reflected in the BP and IEA outlooks. In their main scenarios they estimate fossil fuels to be providing about 75% of global primary energy demand even by 2040.
Another challenge is that during COP23 climate negotiations in Bonn in 2017, parties did not agree and left open how NDCs should be organised, delivered and updated, leaving uncertainty on how national renewable energy commitments would be ramped up. In addition, finance to be provided to poor countries – pledged by rich countries in Paris to provide $100bn/year to the developing world by 2020 – to help them reduce their carbon emissions and deal with climate change is lagging well behind. This is another factor hampering global attainment of Paris climate goals.
But, despite the challenges, renewables and clean energy are the way to go in the longer term. Van Beurden summed it up when he said “This is a long-term journey. There are tough challenges ahead that society will need to address because the transition will require enormous levels of investment, and profound changes in consumer behaviour. Shell is also on a journey. We cannot know exactly how this transition will play out, or how long it will take. But it could mean significant changes for Shell in the long term. We will learn, and adapt our approach over time.” These words are applicable to the whole energy industry, globally.
With rapid technological advancements, continuously falling costs and growing policy and public support, renewable energy growth is expected to be robust, providing a substantial contribution to future global energy needs, cleaner energy and reduction of carbon emissions.