

[NGW Magazine] Lower Gas Prices Vital for Survival
This article is featured in NGW Magazine Volume 2, Issue 17
By Charles Ellinas
Gas producers need to be careful not to exploit their customers or they will exhaust their patience, forcing them to turn to other suppliers and, ultimately, other sources of energy.
Gas prices and gas pricing mechanisms have been undergoing major upheavals over the last ten years, and gas demand has gone up from 2.856 trillion m³/yr in 2005 to about 3.624 trillion m³/yr in 2016. The significant aspect of that growth lies in the share of LNG, where supply went up from about 195bn m³/yr to about 356bn m³/yr. BP predicts that global gas demand will grow to about 5 trillion m³/yr by 2035, with LNG demand rising to about 830bn m³/yr.
These are covered in the International Gas Union (IGU)’s 2017 annual ‘Wholesale Gas Price Survey’ released in July. It is the ninth such survey and it presents findings from a 10-year global review of price formation mechanisms, identifying significant changes over this period of key developments and upheaval in the global gas market.
IGU’s survey report is a useful reference for the natural gas industry globally, as it is based on inputs from countries that cover 90% of total world gas consumption.
These developments are driving future gas markets and prices. In its Gas 2017 report, released in July, the International Energy Agency (IEA) forecasts that the evolution of the role of natural gas in the global energy mix will have far-reaching consequences on energy trade, air quality and carbon emissions, as well as the security of global energy supplies and prices.
In particular, the global LNG market, including supplies, contract terms and prices, is undergoing a major transformation driven by new supplies coming from the US to meet growing demand in developing economies.
DNV GL also concluded in its ‘Energy Transition Outlook 2017’, released early September, that gas will continue playing an increasing role in global primary energy, eventually surpassing oil, with demand growing to 4.250 trillion m³/yr by 2035, and playing a central role in supporting future energy security.
But non-fossil fuels will continue their onward march, approaching close to 50% by 2050. This will increase pressure on fossil fuel oversupply and low prices, the outlook says.
IGU key findings
The key findings of the IGU survey are as follows:
- Average wholesale global prices in 2016 were $3.35/mn Btu. This is the lowest level recorded in all the nine surveys so far (Figure 1).
- In 2016, there was increased price convergence globally, more so than in previous years, as prices generally continued to decline, particularly in Europe, Asia and Asia-Pacific.
- Globally the share of gas-on-gas pricing (GOG) had the largest share, with 45% of all gas trades, rising from 31% in 2005. This was driven by North America, Europe, the former Soviet Union and Latin America.
- Oil-indexed, or oil price escalation (OPE) share stood at 20%, predominantly in Asia-Pacific, Asia and Europe, down from 24% on 2005.
- Regulated gas prices accounted for 31% of total gas trades. This share fell over the 10-year period, from 38% in 2005, mostly through switching to GOG. This has been one of the most significant changes recently, especially in China and India, with 'free-market-based' pricing gaining at the expense of 'regulated' pricing.
- Of all the gas consumed, 28% flows across a border. Pipeline imports are now over 57% GOG, with OPE at 35%, while 76% of LNG imports are OPE, with GOG at 24%.
- The changes in cross-border gas trading were mostly in terms of pipeline imports, where GOG share rose from 23% to 57% between 2005 and 2015, all in Europe.
- In LNG imports GOG share rose from 13% in 2005 to 32% in 2015, but fell back again in 2016 to 24% as the rise in LNG trade was all in contracted volumes linked to oil prices, mostly outside Europe.
- In northwest Europe GOG pricing share is 91%, while in OPE still dominates in the Mediterranean. In Europe, overall, GOG pricing stood at 66% in 2016, up from 64% in 2015, as oil-indexed, OPE, gas prices continued to lose ground.
Figure 1: Wholesale price levels 2005 to 2016 by region

Source: IGU
Overall, ‘regulated’ pricing has been losing to ‘market’ pricing over the 10-year period (Figure 2). The total of ‘market’ pricing rose from 62% in 2005 to 69% in 2016, mirrored by a decline in ‘regulated’ pricing, from 38% in 2005 to 31% in 2016. It is interesting to note that changes are rather gradual, especially over the last 5 years.
Figure 2: ‘Market’ and ‘regulated’ pricing 2005 to 2016

Source: IGU
But there is a marked contrast when looking at wholesale gas prices by region (Figures 1 &3), which presents a snapshot of prices in 2016.
Figure 3: Wholesale gas prices in 2016 by region
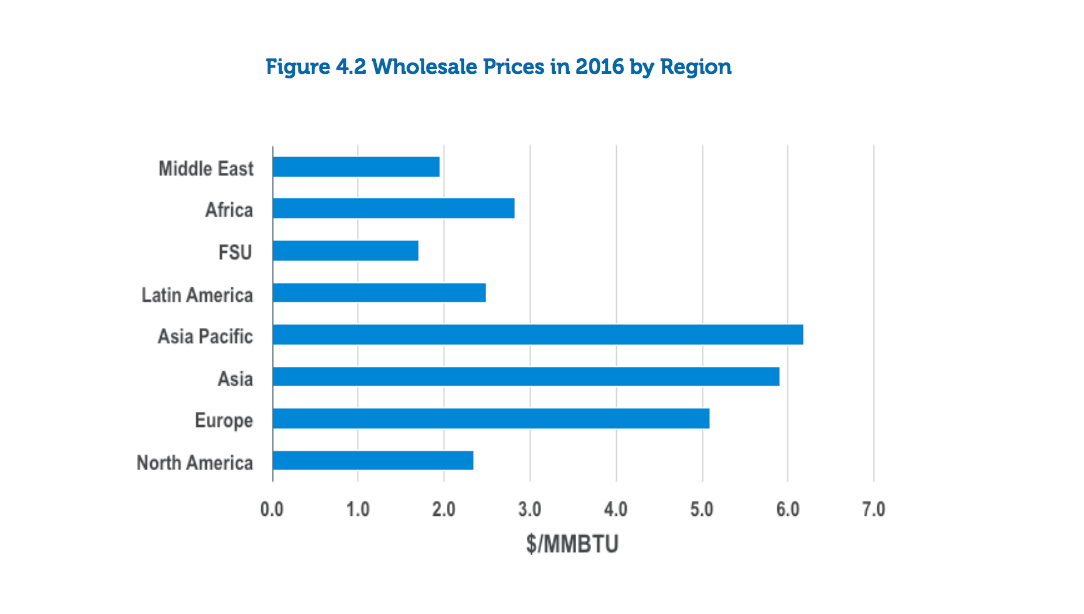
Source: IGU
This is influenced by whether a region is predominantly a gas producer or an importer, and by the type of trading, ie regulated or market-based, GOG or OPE. But there is also huge variability among countries, where the highest wholesale prices in 2016 were in the main in LNG importing countries in Asia-Pacific, South Korea, Japan and Taiwan, plus Singapore and China.
The lowest prices were generally in countries where wholesale prices were subject to some form of regulation and often below the cost of production and transportation, such as Turkmenistan, Algeria and Venezuela.
The shale factor
According to the IEA, the US as the world’s largest gas consumer and producer, will account for 40% of the world’s extra gas production to 2022 thanks to the growth in its domestic shale industry. By that time, its production will be 890bn m³/yr, or more than a fifth of global gas output.
The strong impact of the dramatic increase in shale gas on US wholesale gas prices is clear (Figure 1). This shows prices falling from just over $8/mn Btu in 2005 down to about $2.50/mn Btu in 2016.
Even though US domestic demand for gas is growing, it is not at a rate to absorb this remarkable growth in production. The IEA estimates that more than half of the production increase will be used for LNG for export (Figure 4). By 2022 the US could be challenging Australia and Qatar as the world’s top LNG exporter.
Figure 4: US LNG coming on stream

Source: EIA
IEA CEO Fatih Birol said: “The US shale revolution shows no sign of running out of steam and its effects are now amplified by a second revolution of rising LNG supplies…. Also, the rising number of LNG consuming countries, from 15 in 2005 to 39 this year, shows that LNG attracts many new customers, especially in the emerging world. However, whether these countries remain long-term consumers or opportunistic buyers will depend on price competition.” He added that the environmental advantages of natural gas, particularly when replacing coal, also deserve more attention from policy makers.
But the strongest impact of US LNG is expected to be on contracts and prices. As US LNG exports indexed to Henry Hub ramp up, they are acting as a catalyst for change in the international gas market, diversifying supply, challenging traditional business models and suppliers, and transforming global gas security. They are also helping to increase connectivity between markets and smooth out price disparities. Increasingly, US LNG has the potential to have a similar effect on global gas supplies and prices as US shale is doing to oil.
LNG market challenges
With new plants coming on stream, liquefaction capacity is increasing at a time when the LNG market is already well supplied. Increasing use of FSRUs is also making LNG more accessible and affordable to new countries and markets, and faster. There is already an LNG glut, expected to last well into the 2020s, and it is affecting contracts, business models and keeping prices low (Figure 5).
Figure 5: Landed LNG prices in July 2017

Source: Waterborne Energy Inc
These low LNG prices are also creating increased competition with pipeline gas supplies, loosening traditional pricing and contractual norms and creating new market realities. Changes are being accelerated by US LNG exports, which, as a result of not being tied to any particular destination, are increasing the liquidity and flexibility of LNG trade.
Another key challenge is that European hub prices, Asian LNG spot prices and typical Asian oil-indexed contract prices remain below levels required to take FID on all but the very cheapest LNG projects. This makes launching oil-indexed LNG projects in the prevailing price environment a challenge.
The conundrum the LNG industry faces is that if these prices go up to the levels needed to achieve new FIDs, which is $8-9/mn Btu, they might make gas even less competitive against renewables and thus dig their own grave faster.
This is where US LNG projects may have an advantage, and are expected to play a critical role in global energy balance, as they take the shortest time to be built and provide the most economic incremental LNG supply option. Low liquefaction costs and access to capital and low cost gas resources are also playing a critical role.
There is a view that natural gas plays an important role to support the fluctuating output of unstable renewable energy. But in some parts of the world, the ‘levelized cost of energy’ shows a continued decline in the cost of generating electricity from solar technology and other renewables, which is already bringing them into close and direct competition with combined-cycle gas turbine plants. With the cost of batteries also coming down fast, intermittency may soon become a problem of the past, further accelerating use of renewables.
In Europe, Russia has at least 100 bn m³/yr of spare production capacity, which can be supplied to Europe at short notice and at break-even prices less than $4/mn Btu. This makes serious LNG penetration difficult. But the threat of US LNG is helping keep prices down.
The global energy industry is undergoing a major upheaval and with so much change, and increasingly plentiful and cheap energy resources, it is difficult to say how it will change in the future. Global LNG markets are on the way to further development supported by rising demand and new technologies. What is becoming increasingly clear is that energy prices are likely to stay low for the longer term. Demand uncertainty also means increasing preference for flexible and short-term contracts.
As a result, in order to maintain stable growth of gas and LNG business, maintaining continued competitiveness against coal and renewables will be essential.
Impact on long-term prices
This upheaval in the global gas market is contributing to major changes in gas price formation mechanisms globally and, as IGU observed, a convergence in global prices. In addition, any expectation of gas price hike in the future, as a result of high oil prices, is receding as oil prices are staying low, likely forever.
With abundant supplies and buyers having the upper hand, the target for natural gas is security of supplies at competitive prices against other energy sources.
US
US LNG exports are increasingly driving most of the change in the global LNG industry. Abundant, competitively priced gas, growing liquidity, destination free and flexible volumes make the US LNG trading system more resilient and more responsive. This contradicts the established business model, transforming a point to point business into a global industry, the commodity going where the price is highest.
In addition, as US exports rise there is an increasing influence of Henry Hub price signals on global gas prices. The long-term price forecasts produced by the US Energy Information Administration (EIA) are shown in Figure 6.

Source: EIA
US is providing a flexible response to price signals and a de facto long term cap on prices.
Asia / Asia-Pacific
As the world’s biggest importer of LNG, prices in this region are predominantly based on OPE, with the result that these are higher than anywhere else. This is shown in the long-term price forecast in Figure 7.
Figure 7: Long-term natural gas price forecast for Asia

Source: Facts Global Energy
The ‘strong’ scenario corresponds to high oil price, which is not very likely. In the ‘weak’ scenarios LNG cannot compete on price with other fuels, keeping prices low. In the ‘neutral’ case the long-term price stays at about $8/mn Btu after 2025. The longer-term reality may lie between the ‘neutral’ and ‘weak’ scenarios. In effect this is what IMF is forecasting, with a long-term Asia gas price estimate of $7.50/mn Btu.
Asia lacks trading hubs and even though Tokyo and Singapore are progressing in this direction, they are still some way away from achieving hub status. But there is now a window of opportunity to take advantage of the current buyer’s market to consolidate hub initiatives. A recognized Asian benchmark could facilitate ongoing pricing negotiations and accelerate investment decisions.
In order to deal with price challenges the region needs to:
- Establish gas trading hubs
- Introduce market-based mechanisms into LNG trading
- Do away with destination clauses and introduce shorter term deals
- Liberalise gas markets
- Enter into new deals with new entrants into this market
However, with the ‘Asian premium’ gone and oil prices low, possibly forever, price formation appears to be less important. In Asia buyers’ appetite to diversify away from oil-indexed prices has declined as recent contract renegotiations have shown. But with US LNG imports increasing, Asian prices will become increasingly exposed to Henry Hub pricing.
In Asia there is an increasing preference for spot LNG transactions as buyers become more eager to buy short-term and sellers increasingly look to offload surplus.
In this region, the relative prices of gas and coal are the key factor driving demand, as competition intensifies within the energy sector. Environmental issues are gradually becoming an important driver, but cheap coal remains important to the energy mix well into the future.
In India, especially, gas will struggle to compete with coal unless coal is actively discouraged. However, air quality, especially in cities, could be a key driver for gas, provided it remains affordable.
Europe
In Europe the key developments affecting pricing mechanisms are energy market integration, increasing energy efficiency and decarbonisation of the economy. With low gas prices, gas has already started substituting coal in power generation.
The EU proposed targets for 2030 are: 30% improvement in energy efficiency, 40% cut in greenhouse gas emissions compared with 1990 and 27% share of renewables in the total energy mix. Increasing integration and uniformity of energy policies is also leading to price convergence, led by trading through gas hubs.
Accounting for declining industrial demand and indigenous production, LNG oversupply, storage and impact of the ‘green agenda’ and disruptive technologies, Platts S&P Global produced a long-term price forecast for Europe, Fig 8.
Fig 8 NBP long-term natural gas price forecast

Source: Platts S&P Global
This is influenced by the continued decline in indigenous gas production. The base case ‘Market Scenario’ assumes that Norwegian gas production, NCS, is sustained at about 100bn m³/yr until about 2024 and it then declines to about 50bn m³/yr by 2040, leading to an average long-term gas price of about $5/mn Btu. IMF’s long-term estimate for Europe is $5.60/mn Btu. The ‘NCS Sensitivity’ case is based on forecasts by the Norwegian Petroleum Directorate that Norwegian gas production will decline more slowly, to about 90mn m³/yr by 2036, thus limiting exposure to higher priced global LNG imports to Europe.
In the wake of Brexit, the National Balancing Point may be losing ground, with the Dutch Title Transfer Facility (TTF) hub becoming the European benchmark for longer-term contracts, its dominance over other European hubs only expected to increase in the future. TTF is becoming the most widely used price index for Europe.
TTF is the only place where hedging the US LNG into Europe can be done effectively. With US LNG exports to Europe expected to become more frequent as a result of increased production, Henry Hub pricing will be having increasing impact on TTF and other European hubs.
The other significant development is that the influence of oil-price-indexation on European natural gas hub pricing is weakening and is near to having no influence on longer-term hub contracts. Even Gazprom has effectively adopted a pricing strategy linked to European hubs, becoming more flexible and more competitive. As demonstrated by the IGU survey, gas-on-gas pricing, GOG, dominates.
Longer-term outlook
As shown in DNV GL’s Outlook, gas has an important role to play in a future decarbonised world, but it will eventually need to deal with its carbon status. But clearly, increasing use of renewables and ‘clean’ fuels, as well as energy efficiency gains, are keeping a check on future fossil fuel consumption and prices, including gas. This may be exacerbated if during the forthcoming Paris Climate Agreement reviews targets are tightened even further in the push to limit global temperature rise to the 2degC goal.
Even though long-term price predictions may be potentially subject to many uncertainties, natural gas abundance and oversupply will continue and prices are expected to remain low for the longer term.
This means that increasingly there will be strong competition between oil & gas producers to capture this more limited market. As a result mostly cheaper resources will be able to be developed and compete, mainly in the Middle East, US and Russia. Low-cost producers will use their competitive advantage to increase their share relative to higher-cost producers – as for example Russia is doing in Europe.
More costly resources will find it difficult to compete and increasingly run the risk of remaining stranded, as the world shifts gradually, but surely, from fossil fuels to renewables. We have already been observing this since 2014 with persistently low oil, gas and coal prices. And this is one of the main reasons prices are very likely to remain low for the longer term.
Charles Ellinas