


Navigating Market Sensitivities: A Deep Dive into Winter Forecast Impacts on LNG Trade
Navigating Seasonal Uncertainties
In the volatile world of LNG trade, understanding the impact of winter on market dynamics is crucial. This commentary introduces a novel approach: scenario planning as a strategic tool for navigating seasonal uncertainties. The key insight is that grasping market trends and dynamics is more critical than predicting exact price levels. This methodology is essential for industry players, offering a framework to anticipate and strategize around market fluctuations.
|
Advertisement: The National Gas Company of Trinidad and Tobago Limited (NGC) NGC’s HSSE strategy is reflective and supportive of the organisational vision to become a leader in the global energy business. |
As winter approaches, energy consumption and pricing tend to become less predictable, making sensitivity analysis an essential tool. Weather patterns are ever-changing and can disrupt the balance between demand and pricing, particularly in the LNG trade. It is crucial to have a comprehensive understanding of these dynamics as they serve as an early warning sign of market shifts, turning precision forecasting into a strategic asset.
Europe versus Asia
In a globally connected marketplace, disruptions in one region can have ripple effects in another. Our analysis examines the European and Northeast Asian markets, highlighting the complex interplay between trade and energy. The data reveals a stark contrast between the two regions. While Asia’s market displays a looser correlation between consumption and imports, Europe’s graph shows a tighter cluster with heightened sensitivity to the coming winter’s chill.
Over the past few years, LNG price volatility during winter seasons has profoundly impacted global markets. Colder-than-expected winters have led to sudden increases in demand, causing price surges and supply shortages. Europe and Asia, where LNG is a crucial energy source, have been hit particularly hard. For instance, the winter of 2021 saw a record surge in LNG prices due to unexpected cold snaps, causing disruptions in energy supplies and influencing global energy strategies. Therefore, conducting robust market analysis, including the various sensitivities, can make you much more prepared for such events and is crucial to mitigate their impact.
Sensitivity Analysis
The LNG market is a complex and dynamic environment that demands attention and action from its key players. The interplay between LNG imports and fluctuating prices is intricate and impactful, particularly in Europe, where import volumes are sensitive to shifting weather patterns. Sensitivity analysis is a valuable tool that allows market players to prepare for diverse scenarios and to respond to potential market changes with agility.
RBAC’s G2M2® Market Simulator can help shed light on how weather patterns can influence the market. By analyzing 20 years of historical data, we can better understand the potential for significant volatility. Our research shows that meteorological variability can significantly impact market dynamics, affecting both supply and demand. It’s like painting a canvas with shades of market dynamics and brushstrokes of weather patterns.
The methodology for conducting risk analysis in this context involves creating a range of weather event scenarios, each with varying degrees of severity and likelihood. This involves using historical data to model potential outcomes and then running these scenarios through market simulators like RBAC’s G2M2®. By doing so, we can anticipate different market responses, from supply chain disruptions to price fluctuations. This planned scenario approach is crucial for strategic decision-making, allowing market players to prepare for a spectrum of possibilities rather than react to unexpected events.
The Analysis
The forecasting period begins in December 2023, runs through both winters of 2023-2024 and 2024-2025, and ends in March 2025 (the end of the heating season). The simulations were built based on the G2M2’s 23Q3 base case release, which includes historical data through October 20231.
The following charts (as Figure 1) present key results from this weather-based sensitivity work. On the left panel, we see the forecasted price for Asian and European LNG from the simulations plotted with the base case forecast in $/MMBtu, and on the right panel is the forecasted Asia and Europe LNG imports in BCM/month.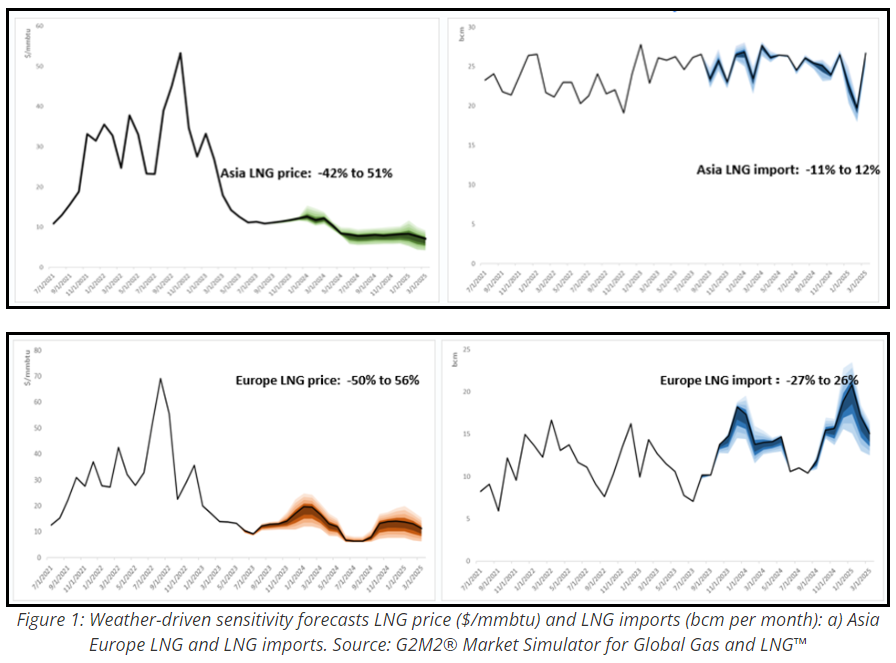
We note a few interesting observations:
- 23Q3base describes a muted LNG price projection for the upcoming winters due to the concerns of economic recovery and a relatively balanced global gas market.
- The weather-based sensitivity analysis consists of normal to colder to coldest, as well as the normal to warmer to warmest, based on HDD data from the past 20 years in both Europe and Northeast Asia (mainly Japan and South Korea). This variation in weather sensitivity has helped create a range of possible outcomes for regional prices and imports of LNG throughout the forecast period.
- With the seasonality of natural gas demand, we observe a wider band of prices in the November to March winter months. In the Asia market, we see a + 51% and –42% of price variation away from its baseline for the peak months, with +12% and –11% of LNG import swings. In comparison, the European market presents a price variation of +56% and –51% from the baseline forecast, with +26%/-27% in LNG import swings.
The complexity of LNG dynamics is significantly influenced by the regional nuances of supply and demand. This becomes particularly pertinent when considering price sensitivities to weather fluctuations, as we observe here.
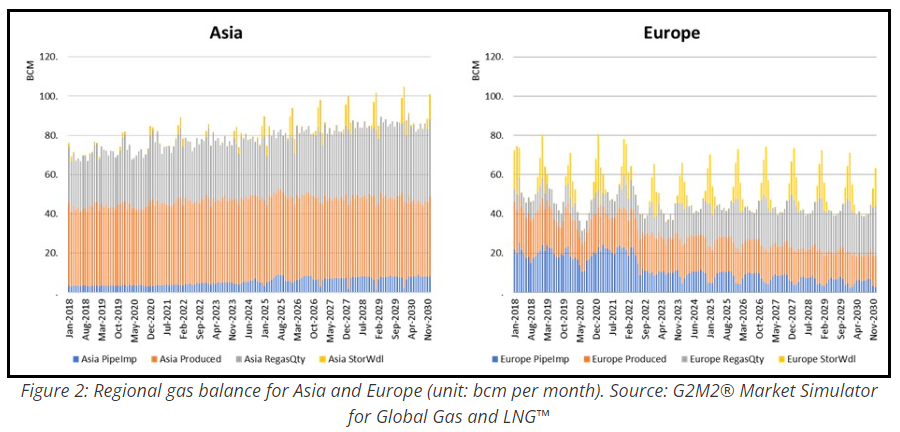
Europe’s gas market demonstrates more sensitivity to such changes than the markets of South Korea and Japan. This heightened sensitivity in Europe is partially due to its reliance on a network of pipelines and underground storage facilities. Underground storage can contribute up to 10-12% of the region’s seasonal gas supply, but as pipeline imports have been declining since 2022, LNG imports have had to pick up the slack and constituted about 25% of Europe’s gas supply in 2023. That proportion is expected to grow to 35% by 2025, further exposing the market to potential price swings.
Conversely, Japan and South Korea are almost entirely dependent on LNG imports due to their scant domestic production and the absence of underground storage. For the broader Asian region, despite LNG imports making up 35-40% of the supply mix, a similar percentage to the European market, the region’s gas balance is fundamentally different. The lack of extensive pipeline infrastructure and storage in Asia means LNG plays a different role in the region’s energy balance.
This discrepancy is evident in Figure 2, which illustrates the regional variations in LNG import dependence and underscores the diverse ways in which regions respond to changes in the gas balance, such as those brought on by weather impacts. For Europe, LNG could be more of a swing supply to meet marginal demand in the region, while for the Asian market, there is not as much aggregated flexibility in supply optionality in general, with more isolated local demand for each country, especially for Northeast Asia.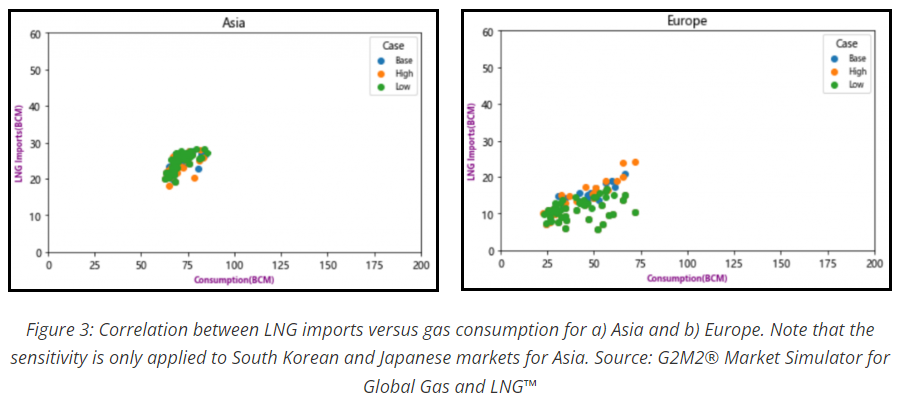
Figure 3 illustrates the correlation of regional LNG imports versus regional gas consumption based on sensitivity simulation, describing how LNG imports correlate as part of the supply mix to meet corresponding gas consumption. The x-axis is the range of gas consumption in the region, and the y-axis is the range of LNG imports. Each dot in the chart represents a single sensitivity run, and the color of the dot represents if the weather scenario of the sensitivity run is warmer than baseline, as the “green” color series with higher HDDs, or colder than baseline, as the “orange” color series, with lower HDDs. Here, “HDDs” is “heating degree days,” which is usually defined as the amount below 65 degrees in the recorded temperature (in Fahrenheit) each day, summed up for the month and is correlated to and used when planning for energy consumption. Higher HDDs indicate higher needs for space heating as a result of colder weather, while lower HDDs indicate lower needs for space heating as a result of warmer weather.