


Mirror, mirror on the wall, which is the greenest LNG of all? [LNG Condensed]
In early October, the US National Energy Technology Laboratory (NETL), under the auspices of the US Environmental Protection Agency, published its 2019 update on its earlier 2014 report Life Cycle Greenhouse Gas Perspectives on Exporting LNG from the United States.
The report is a comparative study looking at the full life-cycle greenhouse gas (GHG) impact of exported LNG used to generate electricity in Europe and Asia versus power generation from locally-sourced coal and from Russian pipeline gas imports. It models LNG exported from New Orleans, as a proxy for the US Gulf Coast, based on both conventional and unconventional gas sources.
For Europe, this is compared against locally-produced coal burnt in power stations, LNG imported from Oran in Algeria and Russian pipeline gas from the Yamal region of western Siberia. For Asia, the comparators are LNG from Darwin in Australia, coal sourced in China and again pipeline gas from Yamal, Russia.
Odd choice
This latter option is an odd choice for Asia as Russian pipeline gas exports to China will come via the under-construction Power of Siberia, with the feedstock gas sourced from the Kovyktinskoye and Chayandinskoye fields in eastern Siberia.
The choice of Yamal gas affects the results considerably, owing to the large chunk of GHG emissions attributed to domestic pipeline transportation for the Russian gas from Yamal to Shanghai, which is the end point of consumption in all the Asian models used. Just as Russian gas will not come Yamal, it is unlikely to be consumed in Shanghai, but in more northerly Chinese provinces.
The reason stated in the report for the use of Yamal is: “Yamal was chosen as the extraction site because that region accounted for 82.6% of Russian natural gas production in 2012.”
However, the result is that the comparison with piped Russian gas is not useful, whereas a comparison with Russian LNG exported across the Arctic, a relatively short route to Asia -- or from eastern Siberia through the Power of Siberia would have been. How would US LNG have fared then?
LNG versus coal
The aim of the study is to answer the question of whether exporting LNG for power generation to Europe and Asia is better or worse in GHG terms than coal or pipeline gas, a question which appears to hinge on the vexatious issue of what time frame is employed to judge the Global Warming Potential (GWP) of methane, and indeed whether GWP is a suitable metric for policy makers at all.
Most discussions on GWP are quick to note that it evolved as a tool for understanding climate change and comparing the relative impact of different GHGs on the atmosphere over a particular time period. It wasn’t designed as a guide for policy makers, yet that appears to be what it has become. As in economics, some numbers, indices or data series can gain significance beyond that which is merited purely as a result of the degree to which they are observed.
For Europe, the study finds that on a 100-year GWP basis, all forms of imported gas are significantly less GHG intensive than burning local coal. Imported coal will have an even bigger GHG impact, owing to transportation emissions.
Given the presentation of a central figure and error bars to express the range of uncertainty, there is not a great deal to choose between the sources, but US LNG comes out as the least GHG intensive, followed by Algerian LNG then Russian pipeline gas from Yamal. Broadly, gas for power generation with imported feedstock is about 38% less GHG intensive than coal-fired power plant burning locally sourced coal, according to the study.
However, the picture changes substantially based on the 20-year GWP. In this case, Russian pipeline gas is almost as GHG intensive as coal-fired generation – 1,015 kgCO2e/MWh as oppose to 1,090 kgCO2e/MWh, although the range of outcomes for coal is much wider, spreading up as far as 1,600 kgCO2e/MWh. US LNG comes in at 719 kgCO2e/MWh, still 34% less GHG intensive than local coal, and Algerian LNG at 865 kgCO2e/MWh, 21% lower than coal.
The reason for this is that a shorter time span for the GWP accentuates the impact of methane vis-à-vis CO2. Methane is more potent as a greenhouse gas than CO2, but its effect does not last as long. The multiplier effect for methane versus CO2 over 100 years is 36, but over a 20-year GWP horizon it is 87.
GWP measures how much energy the emissions of 1 metric ton of a gas will be absorbed by the atmosphere over a given time compared with CO2, for which the GWP is always 1.
The study uses the figures provided by the Intergovernmental Panel on Climate Change (AR5, 2013), which in the original NETL report in 2014 were put at 30 and 85 respectively.
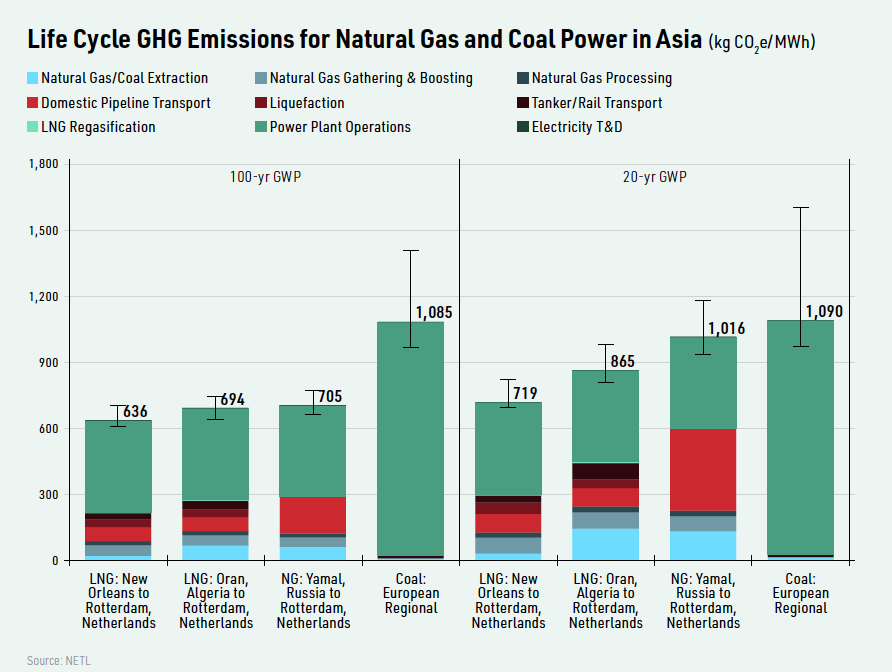
For Asia, the results are similar, although Australian LNG comes out as marginally less GHG intensive than US LNG under a 100-year GWP. The central figure for Darwin LNG is 671 kgCO2e/MWh and 765 for Russian pipeline gas from Yamal, as compared with 1,085 kgCO2e/MWh for regional coal.
However, once again, under the 20-year GWP, Russian Yamal pipeline gas fares very badly, this time coming out as more carbon intensive than regional coal, using the central figure (1,148 kgCO2e/MWh versus 1,090 kgCO2e/MWh respectively).
However, given the over-estimation of the distance Russian gas would have to travel in practice this result is questionable. Adjusting for a proper distance suggests that under the 100-year GWP, Russian pipeline gas is at least on a par with imported LNG.
 20 or 100-year GWP?
Shorter time horizons will always make LNG look worse in comparison with coal because coal’s emissions are mostly CO2, while LNG emits methane along the supply chain and then, like coal, CO2 at the point of combustion. If, as in the case of Russian pipeline gas from Yamal, the proportion of methane to CO2 emissions is higher than for LNG, then the difference between LNG and pipeline gas will also be accentuated by a shorter time horizon.
Environmental organisations such as Greenpeace argue that using the 100-year timescale underestimates the impact of methane on the atmosphere. They also point out that most data on methane is self-reported by the oil and gas industry. The organisation says methane emissions are higher than currently estimated by official bodies and need more attention in climate change policy.
Greenpeace points to an IPCC statement in its AR5 report, which says:
“There is no scientific argument for selecting 100 years compared with other choices (Fuglestvedt et al., 2003; Shine, 2009). The choice of time horizon is a value judgement since it depends on the relative weight assigned to effects at different times.”
Short-term horizons
However, the use of a 20-year GWP also brings problems. According to environmental thinktank Climate Analytics, “introducing 20-year GWPs in reporting or accounting would likely give countries a perverse incentive to refrain from the deep reductions of CO2 emissions that already have been delayed for far too long. This would result in higher CO2 concentrations and ocean acidification than would otherwise be the case.”
Similarly, the US-based Center for Methane Research (CMR) states: “If technology choices or fuel substitutions that reduce short-lived gas emissions simultaneously cause CO2 emissions to increase, the choice of a short time horizon to reduce emissions of gases such as methane may cause the unintended consequence of increasing the long-term magnitude of climate change due to higher levels of long-lived gases, especially CO2.”
Neither CMR nor Climate Analytics would probably have a problem with the IPCC statement that the choice of time horizon is a value judgement. Climate Analytics points out that the 100-year GWP is already a compromise between short and long-term horizons as CO2 stays in the atmosphere for hundreds of years.
If the time horizon were extended, LNG’s relative GHG benefits vis-à-vis coal would increase, just as they decrease when the time horizon is reduced. The choice of time horizon in effect determines the relative weight attributed to long-life versus short-life GHGs.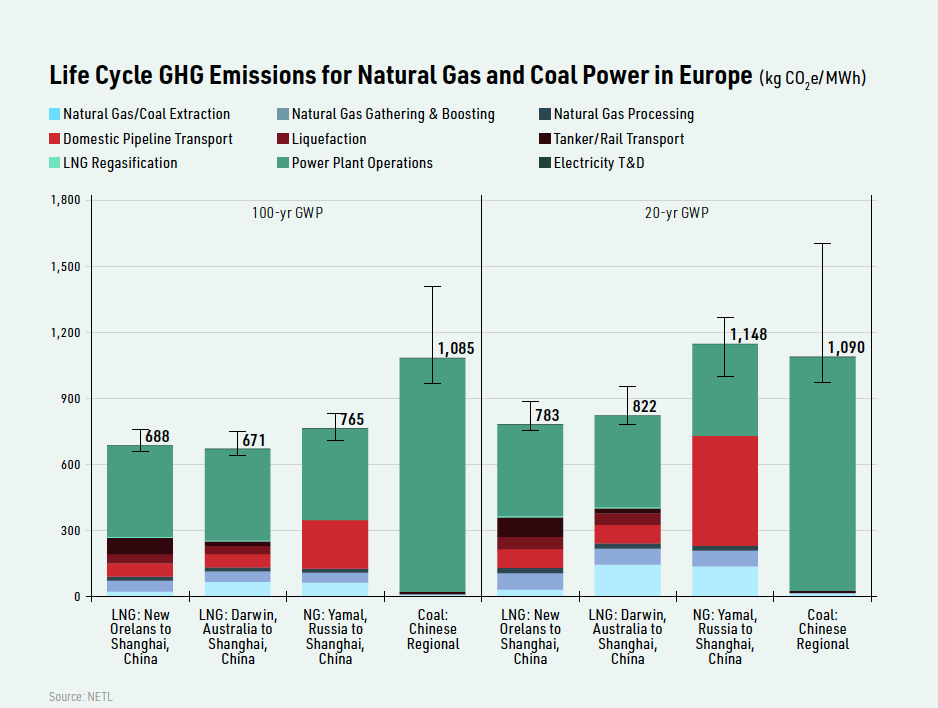
Policy implications
Based on Greenpeace, CMR and Climate Analytics positions the consequences of which time frame becomes the dominant metric for policy makers has implications not just for the LNG industry, but also for climate change.
While Greenpeace argues that the adoption of 100-year GWP underestimates the negative effects of LNG, and distracts from the importance of deploying renewable energy sources, Climate Analytics says that if short-lived GHG gas reductions are prioritised above a similar-sized reduction in CO2 – in terms of 100-year GWP-weighted emissions – the result will be to raise temperatures for many hundreds of years.
The organisation adds: “For the peaking level of warming, and for limiting long-term temperature increase in general, there is no difference if reductions in methane and other short-lived GHGs are achieved now, or with a delay of several decades, while every year of delaying CO2 reductions commits to further warming for centuries.”
Which time horizon becomes uppermost in policy makers minds will affect policy, potentially to the detriment of gas-for-coal switching based on LNG-to-power supply chains. But arguably the real problem is that GWP as a metric has been stretched beyond the original intention.