


LNG Supply/Demand Balances, 2018-2025: Is There a Problem?
The drivers for oversupply have been slower growth in LNG imports and faster growth in supply. In 2017 total LNG imports grew slightly faster than capacity. In the first nine months of 2018 total imports grew year-on-year by 10.1 per cent, while capacity grew by 9.6 per cent. However, in the six months between October 2018 and March 2019, total year-on-year import growth slowed to 8.5 per cent, while capacity growth increased to 12.4 per cent.
The slowdown in import growth was in the Asian markets. China had been growing at almost 50 per cent year-on-year in the first nine months of 2018, but then slowed to just under 20 per cent year-on-year between October 2018 and March 2019. India had been growing strongly in the first nine months of 2018, but growth turned negative between October 2018 and March 2019. It was a similar story for Japan, Korea, and Taiwan, with growth of 8.1 per cent year-on-year in the first nine months of 2018— very strong Korea growth—and then a decline of 5.5 per cent year-on-year between October 2018 and March 2019. Growth in the other Asian markets picked up, but the supply of LNG was mostly diverted to Europe, where in the first nine months of 2018 there was no growth, but in the next six months year-on-year growth was almost 70 per cent. In the second quarter of 2019 import growth and capacity growth stabilized with some plants down for maintenance.
|
Advertisement: The National Gas Company of Trinidad and Tobago Limited (NGC) NGC’s HSSE strategy is reflective and supportive of the organisational vision to become a leader in the global energy business. |
The growth in China has been impacted by a more gradual approach to rolling out the coal-to-gas switch in industry and commercial and residential buildings, as well as higher growth in domestic production and more pipeline imports. In India, growth has stalled on the back of higher LNG prices in early 2018 plus problems with takeaway pipeline capacity, while Pakistan has been slower to connect power plants. Warmer winter weather also affected Japan and Korea.
In effect, since October 2018, LNG import growth has been confined to China (albeit more slowly), Pakistan, and Europe, with all other markets stagnating or in decline.
The next 18 months—more of the same?
The growth in LNG supply has not yet come to an end. In the 18 months from July 2019 to December 2020, another 58 million tonnes per annum (mtpa) or 78 billion cubic metres (bcm) of capacity will be coming onstream. This includes Sabine Pass Train 5, Elba Island, Freeport, Cameron Trains 2 and 3, Corpus Christi Train 3, Yamal LNG Train 4 and PFLNG 2 in Malaysia, plus Tangguh Train 3 in Indonesia shortly thereafter. Other plants are expected to ramp up production—such as Prelude FLNG, Cameron Train 1, Corpus Christi Train 2, the Argentine FLNG project, and Vysotsk LNG, with the Egyptian LNG plants returning to full export mode. LNG imports are expected to continue to grow, especially in China and the emerging Asian markets, but growth is slowing or even turning negative in some markets, such as Egypt, where LNG exports are resuming, and Argentina, which has just started exporting LNG from a floating plant on the back of increasing shale gas production.
The rising supply of LNG is facing competition from new pipeline projects into both Europe and China. In Europe, Nordstream 2 is expected to start up in early 2020, ramping up over time, while Turkstream’s first leg should be online by the end of 2019 and its second leg a year later. The second leg of Turkstream and the expansion of the Trans-Anatolian Natural Gas Pipeline (TANAP) into Greece, together with the Trans-Adriatic Pipeline (TAP) into Italy, should all be operational in 2020 or early 2021. In China the Power of Siberia pipeline from Russia is projected to start up at the end of 2019, ramping up slowly to its full capacity over three to four years.
European production is expected to remain in decline, so even with a mostly flat demand profile, there will be an increasing import gap, which can be filled by both pipeline and LNG imports. In 2018 the imports gap was around 290 bcm, which was filled by 235 bcm of net pipeline imports and 60 bcm of net LNG imports. (There was some net injection into storage as well.) By 2022 the import gap is expected to have widened to 315 bcm, but net pipeline imports could have risen to 255 bcm and net LNG imports to 70 bcm.
In China total demand is expected to grow from 270 bcm in 2018 to around 400 bcm in 2022. Indigenous production may rise by 50 bcm, pipeline imports by maybe 20 bcm as Russian imports ramp up, and LNG imports by 60 bcm over the same four years. Elsewhere in Asia, LNG imports may be more subdued, with Japan, Korea, and Taiwan declining slightly; but more rapid growth may be seen in the Indian subcontinent, with imports almost doubling to over 60 bcm, and the ASEAN countries may see a rise of over 50 per cent.
Up to the end of 2020, supply growth is expected to exceed demand growth, but thereafter the growth in export capacity is projected to stall, enabling demand growth to start eating away at the excess capacity.
How many more LNG FIDs are needed?
The figure below shows the expected build-up of export capacity for those projects which had taken final investment decisions (FIDs) up to the end of 2018.
Committed LNG Export Capacity
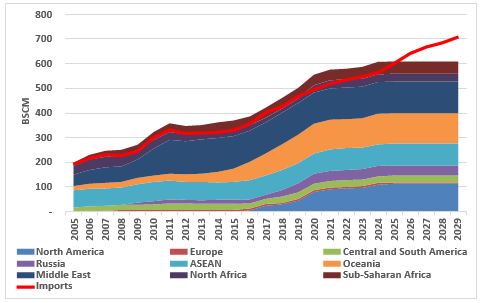
Capacity growth is expected to stall in 2021 and 2022, at which point import growth will start to close the gap. By 2025 the world is expected to run out of export capacity as demand increases. This suggests that more FIDs need to be taken in 2019 to fill the gap.
As at the end of August, four FIDs had been taken: Golden Pass (15.6 mtpa) and Sabine Pass Train 6 (4.5 mtpa) in the US, followed by Mozambique LNG (12.9 mtpa), Calcasieu Pass (10 mtpa), also in the US, and Arctic LNG 2 (19.8 mtpa) in Russia. This gives a total of 63 mtpa already this year. The estimated 40 mtpa to 60 mtpa that needs to be taken to fill the gap, has already been exceeded, and with the further projects that currently have the potential to take FID soon, there could be another excess of supply in 2025/26.
LNG FIDs taken to end September 2019
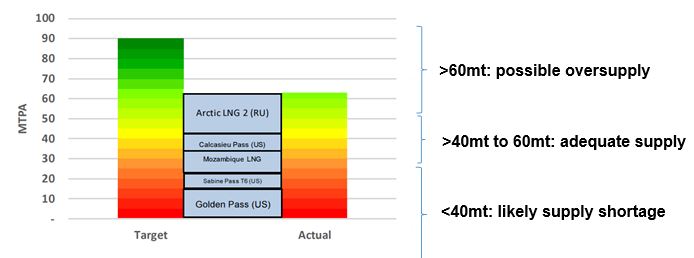
The maximum adequate supply level of 60 mtpa has already been passed, and there are a host of projects lining up to potentially take FID, including the following:
- Rovuma LNG (Mozambique)—15.2 mtpa
- Woodfibre LNG (Canada)—2.1 mtpa
- Qatar 4 train expansion—32 mtpa
- Multiple US projects including Driftwood, Plaquemines, and Texas LNG
In the next 12 months we could easily see another 40 or so mtpa take FID in addition to the 63 mtpa already taken this year.
Potential for another glut in 2025–26
In 2018, total available LNG export capacity was an estimated 460 bcm, while total imports plus the LNG boiled off in transit totalled some 430 bcm—a utilization rate of 93 per cent. By 2022, export capacity is estimated to rise by 26 per cent to 580 bcm, while imports plus boil-off are also estimated to rise by 26 per cent to 540 bcm, giving a marginally higher utilization rate.
With all the FIDs already taken and more possible, we are looking at a sharp rise in export capacity to some 750 bcm by 2026— 130 bcm (almost 30 per cent) above 2022. Demand (LNG imports plus boil-off) will continue to rise but much more slowly, possibly only by 100 bcm, suggesting a potential glut significantly greater than what we are seeing now.
A key uncertainty in this analysis is how demand might grow in the main LNG-importing countries and regions, and what this might mean for LNG imports. We have already discussed the 2018 to 2022 period. The 100 bcm rise expected from 2022 to 2026 is likely to be led by the ASEAN countries, with the Philippines and Vietnam joining Indonesia, Malaysia, Singapore, and Thailand to add 30 bcm, and the Indian subcontinent adding 23 bcm, with Pakistan particularly strong. China’s growth is likely to slow to only 23 bcm, with almost no growth in Europe. The use of LNG as a bunker fuel globally might add some 7 bcm, together with slow growth in other regions and only very minor growth in Japan, Korea, and Taiwan.
Overall Chinese demand growth is expected to be strong through 2026 with total demand reaching 500 bcm from 400 bcm in 2022. Production growth may be just under 40 bcm, but strong growth in pipeline imports from Russia and Central Asia will likely hold back LNG imports. In Europe, demand is expected to be flat, but with production declining, the import gap will likely widen by 25 bcm, split between pipeline imports and LNG imports.
China and Europe may be key areas of uncertainty, since their import gaps represent the difference between two large numbers, and LNG competes with pipeline imports, so any small changes in demand, production, or pipeline imports could materially change the outlook for LNG and rapidly eliminate the 60 to 70 bcm supply overhang in 2026—60 bcm would take utilization to 93.5 per cent, while 70 bcm would increase it to almost 95 per cent, similar to levels in late 2017 and early 2018. There are other potential pockets of growth as LNG expands into new markets, including possibly in sub-Saharan Africa.
However, there are also downside risks, notably with Chinese demand and whether the other Asian markets—outside Japan, Korea, and Taiwan—will be able to continue the expected rapid growth.
What does this mean for prices?
The dramatic fall in prices since October 2018, when Japan spot prices were over $11 per million Btu and TTF (Title Transfer Facility) prices over $8, was the consequence of the glut of LNG on the global markets. Asian spot prices had fallen to the “mid
$4’ by July of this year and were very briefly at the same level as or even below European prices. The TTF price, meanwhile, closed at $3.27 for the July contract, as LNG flooded into Europe and storage was rapidly filled.
In the absence of shocks to the market, one of which could be a failure to reach a new deal on Ukrainian transit, there seems little reason for a material rise in prices, if there is not a very cold northern-hemisphere winter. As the growth in export capacity slows in 2021, 2022, and 2023, rising demand may start to tighten the market, pushing prices higher.
However, by 2025/26, the prospect of very significant growth in export capacity, again well in excess of possible import growth, seems likely to put downward pressure on spot prices.
Conclusions
The rapid decline in spot prices in both Asia and Europe since October 2018 has been a reflection of the growing glut of LNG supply, as import growth in Asia has stalled or even declined in some countries, and especially as Chinese growth slowed. With LNG export capacity continuing to grow through the end of 2020 and into 2021, in the absence of any demand-side shocks, the prospect is for continued price weakness for another 18 months or so.
However, not much supply is expected to come online between 2022 and 2024, and even modest growth in LNG imports will begin to chip away at the supply overhang, with prices likely to firm up. In 2019, though, there have already been four FIDs, totalling some 63 mtpa, with many more lining up to be taken in the next 12 to 18 months. This seems likely to result in another surge in LNG export capacity to come online in 2025–26, significantly in excess of potential demand growth, suggesting another glut may be in the offing.
The statements, opinions and data contained in the content published in Global Gas Perspectives are solely those of the individual authors and contributors and not of the publisher and the editor(s) of Natural Gas World.