

IEA: curb emissions – or else [NGW Magazine]
The International Energy Agency (IEA) released its 2019 World Energy Outlook (WEO 2019) November 13, with the strong message: carbon emissions’ growth has to be curbed. According to IEA, there is a wide gap between what science dictates must be done to cut greenhouse gas emissions, and the reality: energy-related emissions hit another historic high in 2018.
As one of the most influential products of its kind, referred to by governments, companies and investors worldwide, it attracts a lot of attention – some of it critical.
This article is based on the Stated Policies Scenario (Steps) that incorporates today’s policy intentions and targets – previously known as the New Policies Scenario in WEO 2018 –considering only specific policy initiatives that have already been announced. The other two are Current Policies (CP) and Sustainable Development (SDS, or “fingers crossed”).
The main conclusions from WEO 2019 are:
- Energy security remains paramount, and oil stays in the spotlight – from physical security, to trade wars and sanctions, to cyber-security and trade wars.
- If the world is to turn today’s emissions trend around, it will need address emissions from existing power plants, factories, cargo ships and other capital-intensive infrastructure already in use.
- Despite rapid changes in the power sector, there is no decline in annual power-related CO2 emissions in Steps, mainly because the existing stock of coal-fired power plants that account for 30% of all energy-related emissions today will be polluting the air for years to come.
- Electricity use grows at more than double the pace of overall energy demand, confirming its place at the heart of modern economies, with solar PV becoming the largest component of global installed capacity and offshore wind gathering speed.
- The share of electricity in final energy consumption will overtake oil by 2040 as it moves to the heart of energy security, with cost reductions in renewables and advances in digital technologies. Wind and solar PV could provide more than half of the additional electricity generation to 2040.
- Global growth in oil demand slows markedly post-2025 before flattening out in the 2030s, but consumer preferences for SUVs could offset the benefits from electric cars.
- Africa becomes increasingly influential for global energy trends, with its oil demand exceeding that of China’s by 2040. But the big open question for Africa remains the speed at which solar PV will grow.
- A three-way race is underway among coal, natural gas and renewables to provide power and heat to Asia’s fast-growing economies. Renewables are the main challenger to coal: gas use has been growing fast but market competitiveness remains a key uncertainty.
- Shale output from the US stays higher for longer, reshaping global markets, trade flows and security - accounting for 85% of the increase in global oil production and for 30% of the increase in gas to 2030.
- The speed at which battery costs decline is a critical variable for power markets as well as for electric cars. Battery costs could decline even faster, making combined solar and battery storage plants a very compelling economic and environmental proposition.
- Gas grids are crucial, delivering more energy than electricity networks and providing a valuable source of flexibility. But can they deliver truly low- or zero-carbon energy?
The IEA says governments are uniquely placed to solve the problem of affordable, secure and sustainable energy supply on a national level: only they can attract energy innovation and investment.
 Global energy
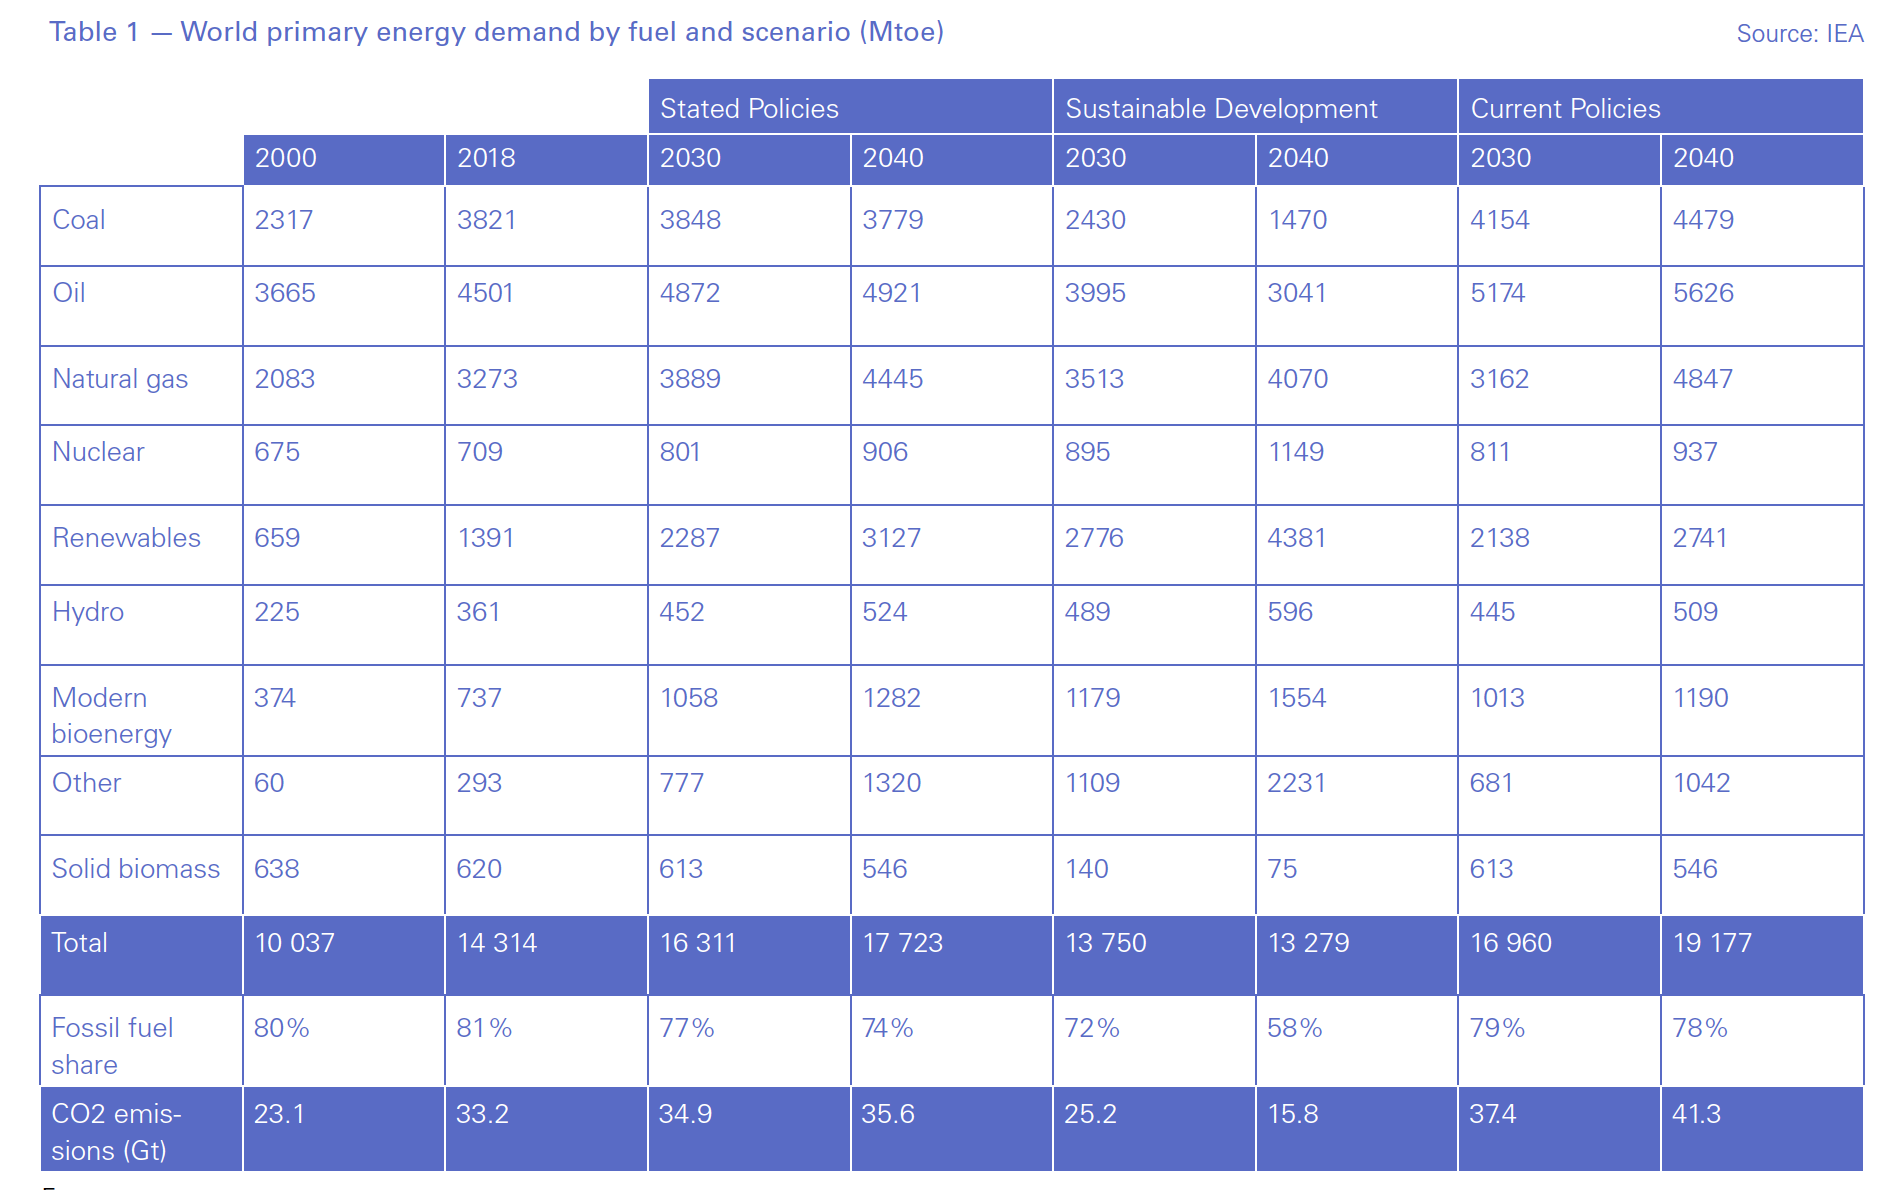
An overview of global primary energy demand by fuel and scenario shows some interesting trends (Table 1). In Steps, primary energy demand grows by a quarter by 2040, in comparison to 2018. This is in response to increasing world population and GDP. It is only in the rosy SDS that global primary energy, and emissions (Figure 1), actually decline by 2040.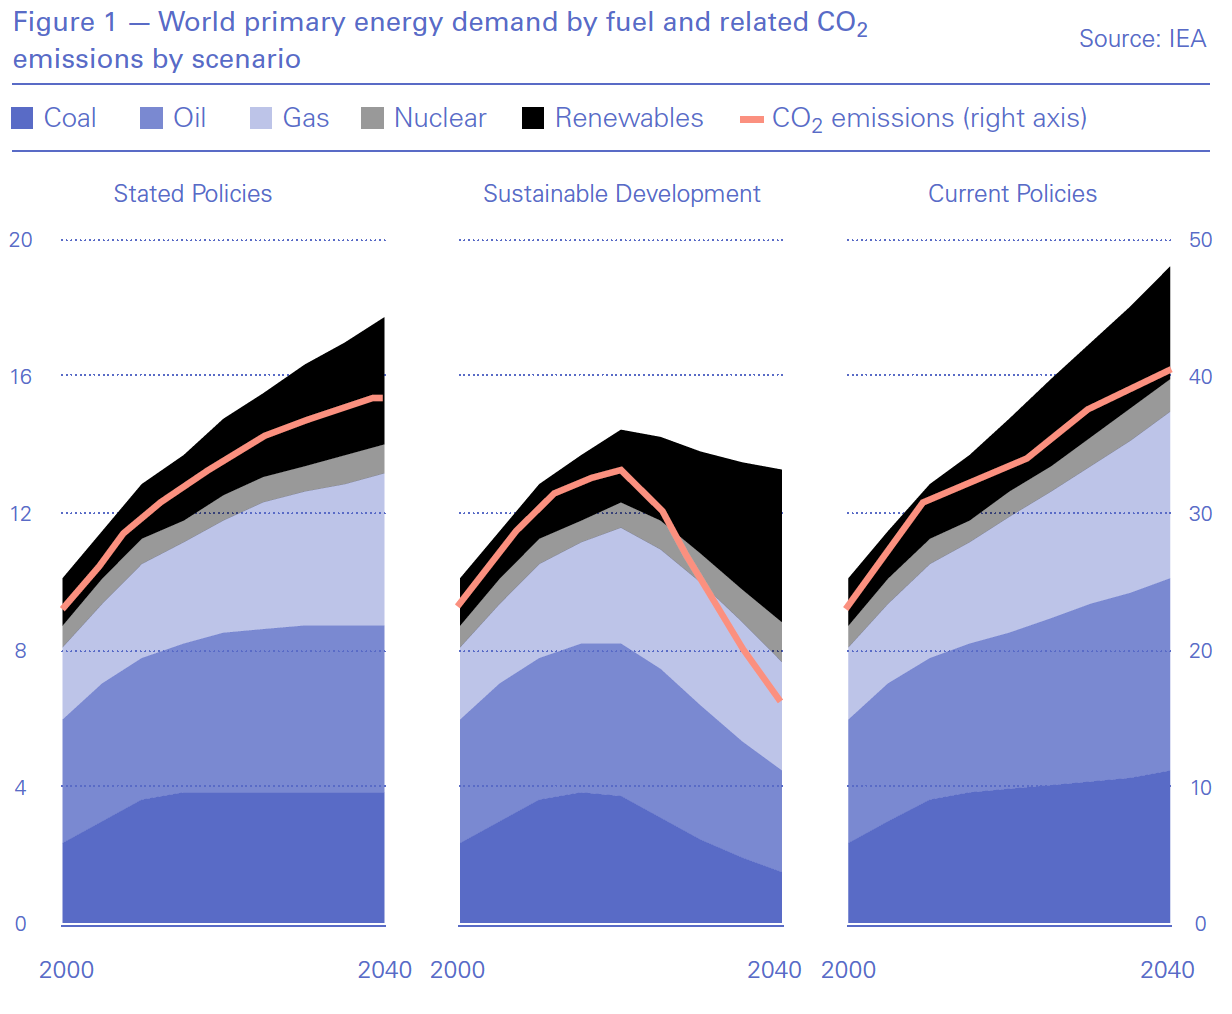
Close to two-thirds of the increase in global energy demand comes from the Asia-Pacific region. In all scenarios India is the largest worldwide driver of energy demand growth, but China is the largest overall energy consumer.
Despite growth in renewables outpacing growth in all other forms of energy since 2010, the share of fossil fuels in global primary energy demand has actually gone up: from 80% in 2000 to 81% in 2018.
The share of solar and wind in 2018 was still small, but by 2040, 49% of global energy demand growth in Steps is met by renewables: wind, solar, hydro and bio-energy. Natural gas demand shoots up too, providing 35% of energy demand growth and overtaking coal.
Without drastic change, global primary energy demand continues to grow, with the fossil fuel share to 2040 remaining high, 74% in Steps and 78% in CPS. Even in SDS this share is still high, at 58%.
Between 2000 and 2018 global energy use rose by 42% and emissions by 44%. By 2040 emissions grow to 36 Gt in Steps and over 40 Gt in CPS (Figure 1). Coal contributes about a third of these emissions.
In Steps, trends in emissions demonstrate significant regional variations (Figure 2). They decline in advanced economies, with EU taking the lead, but they increase almost everywhere else.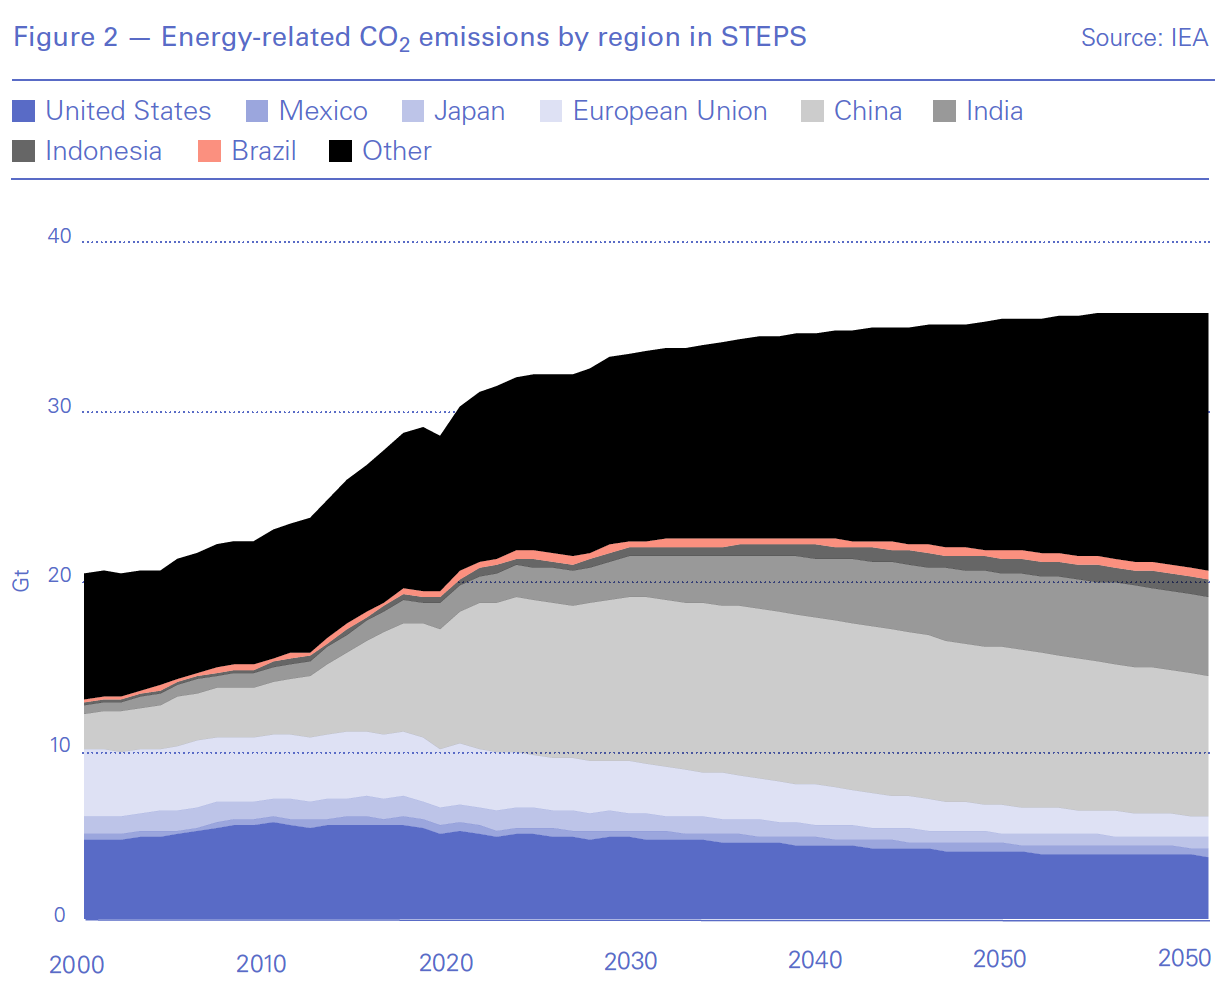
In Steps, rising emissions are predicted to lead to a world temperature increase of more than 2.7 °C.
Only under the more ambitious SDS scenario – aligned to the Paris Agreement goals – energy demand peaks by 2020, while emissions decline from a peak of about 33 gigaton (Gt) CO2 to about 15 Gt by 2040 and to 10 Gt in 2050. According to the IEA this can put the world on track to achieve net-zero emissions by 2070 and a temperature increase of 1.8 °C (with a two-thirds chance of success). But this would require emissions to fall in advanced economies at an average of 5.6%/yr until 2050, and by 3.2%/yr in developing economies.
Higher emissions may be a factor in increasing global energy demand. According to the IEA almost 20% of the growth in last year’s global energy use was “due to hotter summers pushing up demand for cooling and cold snaps leading to higher heating demand.”
Electricity outlook
WEO 2019 sees electricity demand following two distinct regional paths. In advanced economies, growth linked to increasing digitalisation and electrification is largely offset by energy efficiency improvements. In developing economies, rising incomes, expanding industrial output and a growing services sector push demand firmly up. But even then, by 2040 electricity demand per person in developing economies remains 60% of that in advanced economies.
In 2018 electricity accounted for only about 19% of final energy consumption, rising to 24% in Steps and 31% in SDS by 2040. China accounts for a third of this growth followed by India with 20%. This is a key reason why renewables alone cannot solve the climate challenge, but solar PV will become much more competitive by 2030 if the cost reductions so far continue.
The IEA says that these, and major cost declines for wind, are “bolstering the economic case for switching directly from coal to renewables.” Cost-competitive offshore wind projects in Europe have created interest for such projects in China, the US and elsewhere.
In Steps, renewables dominate investment and power capacity additions in comparison to other energy sources by 2040, with solar PV taking the lead (Figure 3). Gas capacity additions also increase significantly, as gas expands its role as a provider of power system flexibility.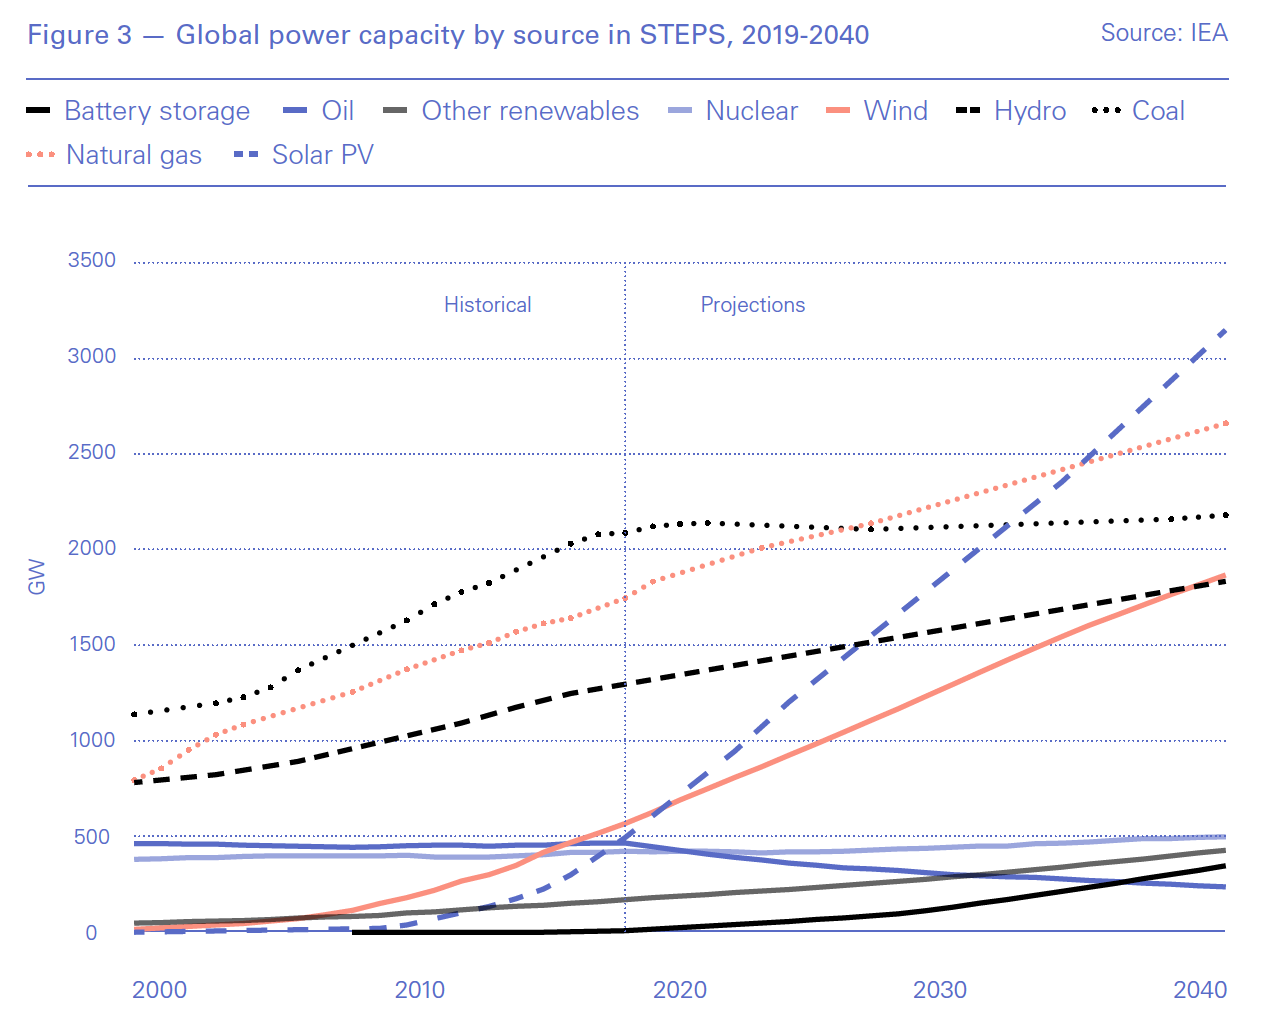
In SDS, wind and solar PV provide almost all the increase in electricity generation to 2040, with the share of renewables in the electricity mix rising from a quarter today to two-thirds in 2040. Electric vehicle adoption sees a massive increase from 9.2mn cars in 2017 to more than 933mn in 2040.
But such developments will increase the need to address challenges posed by variable renewables on the electricity sector. The IEA says that, as a result, “Policy makers and regulators will have to move fast to keep up with the pace of technological change and the rising need for flexible operation of power systems.” With falling costs, battery storage capacity rises 40-fold by 2040, becoming the fastest growing flexibility option in Steps (Figure 3).
Gas outlook
Natural gas retains a critical role in global primary energy to 2040. Its share grows to about 25% in Steps – and to four fifths of that even in SDS. Cost competitiveness, sustainability, and security of supply are critical factors.
The US will account for 30% of the increase in natural gas production to 2030, mostly due to shale production remaining higher for longer. More than half of its gas production exported as LNG, reshaping global markets and flows. Referring to this, Fatih Birol, IEA executive director, said: “The shale revolution highlights that rapid change… is possible when an initial push to develop new technologies is complemented by strong market incentives and large-scale investment.”
Russia continues to be the largest producer after the US, while Qatar remains the world’s largest LNG exporter. Australia faces declining gas production – striving to balance exports with growing domestic demand – but Mozambique and Iraq emerge as growing producers.
Asia accounts for about half the growth in global gas demand and almost all of the increase in traded volumes globally (Figure 4). China leads this growth, with the share of gas in its energy mix nearly doubling by 2040, to 13% from 7% in 2018 – but this is dependent on LNG prices and security of supplies considerations. In India, the prospects for natural gas are limited by supply constraints and affordability issues, as well as by the lack of infrastructure.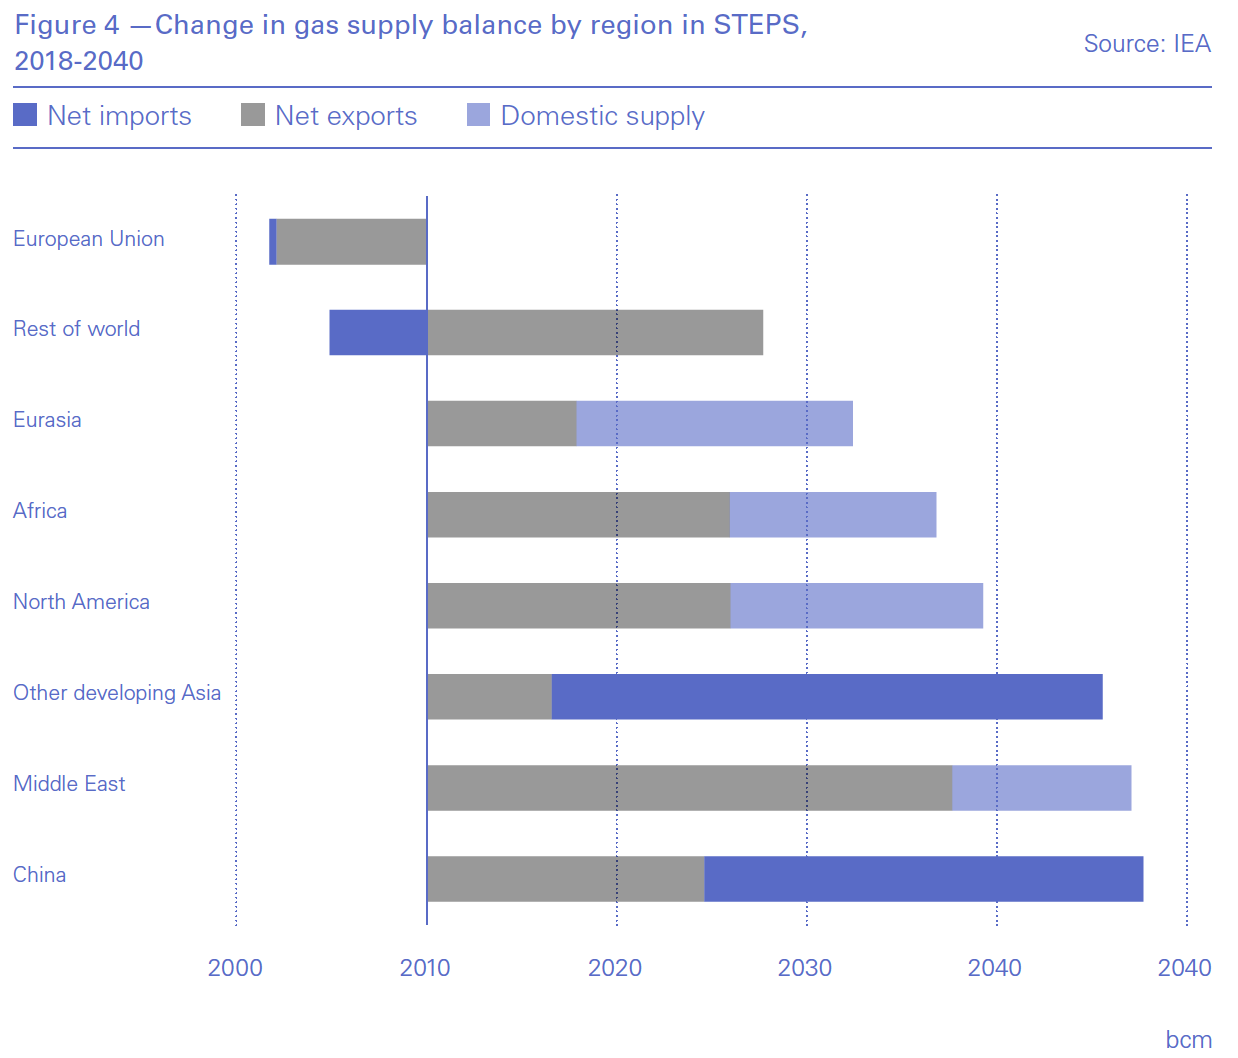
Most demand occurs where it is produced, with developing countries in Asia underpinning most of the growth in gas imports. LNG dominates gas trade, with technological and financial innovations, and a growing spot market lowering barriers to entry.
Still, investment in liquefaction, transportation and regasification adds to the cost and makes LNG a relatively expensive fuel for developing markets. The IEA says that competition from other fuels and technologies, such as coal and renewables, “looms large in the backdrop of buyer sentiment and appetite to take volume or price risk.”
However, there are major variations in global gas demand depending on the different parts of the world and on scenarios (Figure 5).
WEO 2019 also considers the role that natural gas infrastructure can play in the transition to a low emissions future, particularly in leveraging existing systems to support the emerging hydrogen economy. In this respect natural gas grids can contribute to energy security. The IEA states that “gas grids provide a crucial mechanism to bring energy to consumers, typically delivering more energy than electricity networks and providing a valuable source of flexibility.”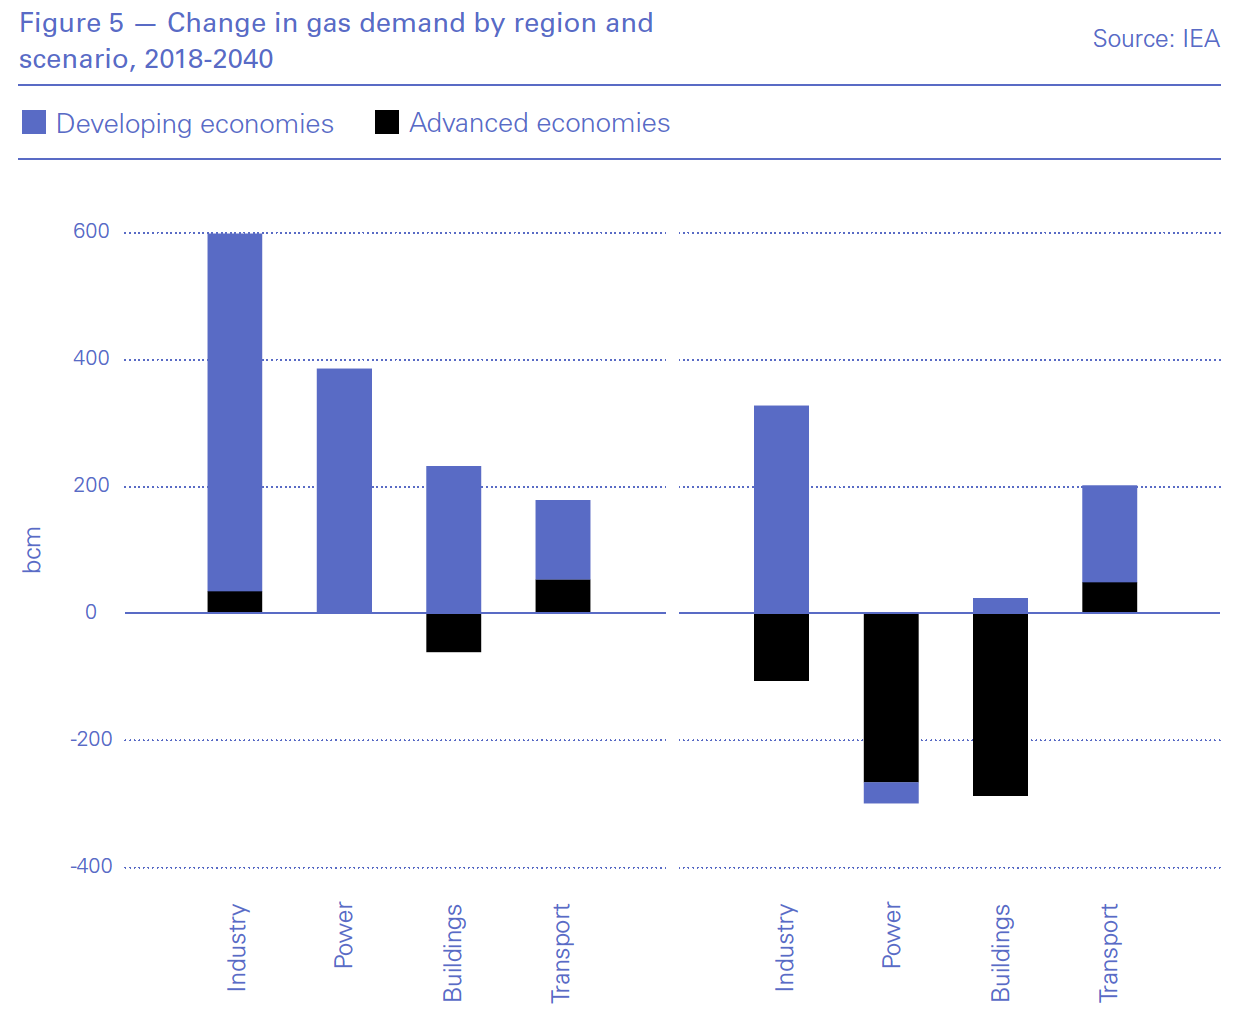
WEO 2019 also highlighted concerns about associated gas from oil production. The IEA estimates flaring and venting together from this source accounted last year for 200bn m³.
On the positive side, the IEA noted that in 2018, natural gas over its life cycle resulted in 33% fewer CO2 emissions on average than coal per unit of heat used in the industry and buildings sectors, as well as 50% fewer emissions than coal per kWh.
This demonstrates that coal-to-gas switching can still provide ‘quick wins’ for global emissions reductions. But given the cost difference between coal and gas, the IEA says that there may be a need for additional policy support – carbon prices or regulatory intervention – to capture these.
Oil and coal
The IEA predicts that global oil demand will reach a plateau at about 2030, at 105.4mn b/d, as the use of more efficient cars and electric vehicles impacts oil consumption and grow very slowly thereafter to reach 106.4mn b/d by 2040.
The IEA warns that the continuing global rise of SUVs may start challenging efforts to reduce emissions. They could add 2mn b/d to global oil demand.
The IEA said that US shale oil production is likely to stay higher for longer, reducing the share of Opec+ in the global oil supply. As a result, the US is expected to provide 85% of the growth in production to 2030, overtaking Saudi Arabia’s combined exports of crude and refined products by 2025, to come close to 21mn b/d.
OPEC+’s share of the global market is expected to decline to 47% by 2025, and by 2030 it may still be at 2018 levels. But according to the IEA, whichever pathway the energy system follows, “the world is set to rely heavily on oil supply from the Middle East for years to come.”
Birol said that the US supply of oil had helped to stabilise markets, to the extent that even a major supply loss such as September’s attacks on Saudi facilities had little impact on prices.
Implications
Indicative of the challenges ahead, in presenting WEO 2019, Birol said: "There is no single or simple solution to transforming global energy systems. Many technologies and fuels have a part to play across all sectors of the economy… For this to happen, we need strong leadership from policy makers, as governments hold the clearest responsibility to act and have the greatest scope to shape the future."
According to the IEA, energy efficiency is the single most important factor in tackling emissions, followed by renewables.
In fact, under SDS, the IEA says that spending on energy efficiency must reach $16.7tn by 2040. This corresponds to $625bn/yr for the next ten years, and about $920bn/yr from 2030 to 2040. Investments in renewables must also reach $650bn/yr for the next ten years in order to meet SDS energy goals. This is substantially more than now. Global energy investments in 2018 totalled $1.85bn, with 50% spent on fossil fuels. With only about $330mn invested on renewables and about $240bn on energy efficiency, the challenge is clear.
Some of the criticism WEO 2019 has attracted is that its SDS scenario relies on large-scale deployment of negative emissions technologies to achieve holding the rise in global temperatures to well below 2 °C, pursuing efforts to limit it to 1.5 °C. Even the IEA admits that there are uncertainties about their required scale, impact and costs.
In addition, those who expect pathways towards the complete phase-out of fossil fuels are disappointed.
Nevertheless and despite its function, the IEA faced renewed pressure from investors and scientists concerned about climate change to overhaul its projections for fossil fuel demand and to do more to support the implementation of the 2015 Paris Agreement to avert catastrophic global warming. They are asking the IEA to change the way the report is produced and presented, for example by using more ambitious targets that could spur an even faster switch to renewables.
But there is some wishful thinking behind these demands about how quickly the transition to cleaner energy could happen.
The IEA can only go as fast as science, technology, markets, policies, and costs improve. What is clear "is that there are no simple solutions to transform the world of energy."
While the world understands the importance of transitioning to carbon neutrality, global energy is still heavily dependent on fossil fuels and it will remain so unless there are major changes in policy – driven by governments. The IEA recommends policy makers and regulators move fast to keep up with the pace of technological change and the rising need for flexible operation of power systems. Birol called “for a grand coalition encompassing governments, investors, companies and everyone else who is committed to tackling climate change,” to bring down global emissions.