


Hydrogen: A Hot Commodity Lacking Sufficient Statistics
Hydrogen has become one of the most debated topics in the energy industry. As an energy vector,[1] hydrogen has been touted as a possible path to decarbonize energy sectors that are considered difficult to electrify, such as heavy-duty transport. While hydrogen expansion faces challenges associated with introducing it into new sectors and decreasing the cost of green (or low-emission) hydrogen, major economies such as China, the EU, and the United States have been looking to integrate its use into their decarbonization strategies.[2] Demand for hydrogen could more than quintuple in a global net-zero-carbon-emissions scenario.[3]
Given that hydrogen’s role is expected to increase significantly over the coming decade and expand into new sections of the energy system, it is essential to have more clarity on its current and future demand profile. The energy community is used to relying on statistics for more traditional fuels such as oil or natural gas; they enable analysts and investors to follow market developments, identify trends, and anticipate investment needs and opportunities. For policy makers, they can help to measure progress toward decarbonization objectives or against targets set within their hydrogen strategies as well as help them compare their activity with other countries’ developments. Understanding demand, production, and trade through data transparency is also a key element in energy security.
|
Advertisement: The National Gas Company of Trinidad and Tobago Limited (NGC) NGC’s HSSE strategy is reflective and supportive of the organisational vision to become a leader in the global energy business. |
Among the challenges facing hydrogen are some basic data issues. They revolve around three major items:
- The definition of hydrogen demand, which leads to different estimates of current hydrogen demand
- The availability of basic data on current demand and production at national levels
- The use of different units of measurement and conventions for hydrogen, which can lead to widely varying estimates
In this piece, the author explores the different issues around measuring hydrogen demand, production, and trade, and makes recommendations to improve data coverage and harmonize unit conventions. The fact that hydrogen is still at a relatively nascent stage requires some thinking by statistical agencies on what definition of hydrogen to use, which data to collect, and how and whether to include hydrogen-related fuels such as ammonia and methanol in demand statistics. Being at the early stages of the hydrogen economy also offers an opportunity to build something robust in preparation for its future while at the same time solving some existing issues around definitions, methodologies, and units. While some agencies are already working to fill in the blanks, these efforts are likely to take some time. The ultimate goal will be to speak a common language around this new energy vector.
A Definition Issue
The problem starts with a very simple question: how much hydrogen does the world consume today? The answer is: it depends on how one defines hydrogen. The International Energy Agency (IEA) distinguished the following three categories in The Future of Hydrogen report[4] and in subsequent reports such as the Global Hydrogen Review 2021:[5]
- Pure hydrogen demand, mostly used in oil refining and ammonia production, estimated at about 72 million tons (Mt) as of 2020
- Hydrogen demand, which includes pure hydrogen as well as about 18 Mt of hydrogen mixed with other gases for the production of steel and methanol, at 90 Mt.
- Total hydrogen demand, including pure hydrogen and a further 45 Mt (as of 2018) used in industry without prior separation from other gases (including the 18 Mt mentioned in the previous bullet), estimated at about 120 Mt.
Other organizations use one of these different categories, either drawing on their own analysis or using IEA data. For example, the International Renewable Energy Agency (IRENA) used the largest definition in its latest report about the geopolitics of hydrogen.[6]
Very Few Statistics on Hydrogen Exist
In order to better understand the inner workings of any aspect of the energy system, statistics are essential. The IEA, Eurostat (which covers the European region), APEC (which covers the Asia Pacific region), and the United Nations are well-known sources of such energy statistics at global and national levels. Countries’ own statistical agencies are another source of data. However, access to a similar level and quality of data commonly found for oil, gas, and electricity generation is not available for hydrogen. In fact, there are very few statistics on hydrogen consumption, and when they do exist, they do not cover demand in all existing sectors or do so only for specific plants.
Meanwhile, there is hardly any data on how the hydrogen is produced. That may largely be explained by the much lower interest in hydrogen until a few years ago, and the fact that a significant part of hydrogen production never leaves production sites. What is not consumed on site is transported by truck or pipeline: there were only about 4,000 kilometers of hydrogen pipelines in the world in 2016, the bulk of which were in the hands of three companies: Air Products, Air Liquide, and Linde.
Hydrogen production plants can be divided into three main categories:
- Captive production facilities, where the hydrogen is produced on site for the plant’s own consumption
- Merchant production facilities, where hydrogen is sold externally
- By-product production, where hydrogen is a by-product of other processes (such as chlor-alkaline production)
Though a significant part of the hydrogen consumed today is captive, statistics sometimes only report the merchant portion. The treatment of by-product hydrogen varies. These factors can lead to different estimates for hydrogen demand. In a comparative study looking at the size of the hydrogen market in the United States and globally, the US Department of Energy (DOE) found that estimates for hydrogen production in 2016 from three different sources (2 on production and 1 on production capacity) varied from 9 to 15 Mt for the United States and from 65 to 100 Mt for the world.[7] DOE concluded that the difference within these estimates came mostly from by-product hydrogen, while the variation for estimates of merchant and captive hydrogen production was within ±10 percent.
Officially reported statistics on hydrogen are limited. Available sources on hydrogen demand and use, based on the author’s knowledge, include the following:
- In the IEA’s as well as Eurostat’s and APEC’s statistics, data on hydrogen are found and included in the “other hydrocarbons” category,[8] not singled out individually.[9] In the IEA’s extended energy balances, the production of “other hydrocarbons” in the world amounted to 2.5 exajoules (EJ) in 2020, which would equal about 21 Mt of hydrogen if that category included only hydrogen.[10] This is significantly below any other demand numbers quoted above because not all hydrogen consumption is reported. For example, hydrogen consumption in the production of ammonia, which is done in captive plants, does not appear directly in the balances. Ammonia production is included in the “non-energy use” sector, but the consumption of “other hydrocarbons” there is zero. The energy used for “non-energy use” is directly reported through the consumption of primary fuels such as natural gas or coal, but not as hydrogen. Additionally, in oil refining, hydrogen produced and consumed inside the refinery is not tracked in energy statistics: only the hydrogen coming from outside the refinery (merchant or by-product) is counted.
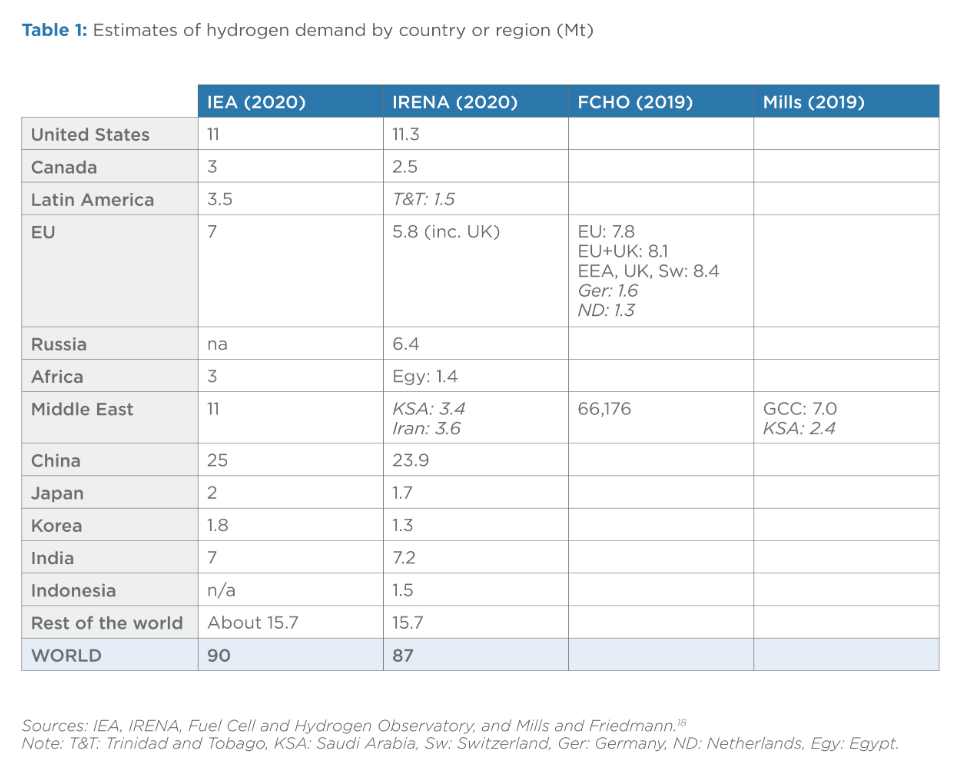
- Eurostat reports total hydrogen production in the European Union[11] in a database on manufactured goods. It is estimated to be about 14 billion cubic meters (bcm), which translates to about 1 Mt (compared to other estimates ranging between 6 Mt and 8 Mt for Europe, as noted in Table 1).[12]
- The Fuel Cell and Hydrogen Observatory published the most comprehensive dataset for Europe by country and by use based on different sources for the year 2019[13]—the first and as yet only time it has published such data. European demand is estimated at 8.4 Mt.
- The US Energy Information Administration (EIA) publishes data on hydrogen demand in refineries[14] in the United States, as well as the consumption of natural gas used to produce hydrogen at refineries.[15] Canadian statistics use the same definitions.[16] The hydrogen quantities reported by refiners include hydrogen produced from plants located at refineries and hydrogen purchased from third-party suppliers, but do not include hydrogen produced from catalytic reformers. Hydrogen input from refinery reformer units is counted indirectly as input of crude oil and unfinished oils. Moreover, the use of hydrogen in manufacturing is collected every four years as part of the EIA’s Manufacturing Energy Consumption Survey.[17] But because hydrogen is produced and consumed in only a few industries and regulations protect disclosed data from being identifiable, hydrogen demand data is most often hidden within the “other” category.
Table 1 presents hydrogen demand estimates from the IEA and a few other sources that give individual data by country in specific regions.
Estimating Hydrogen Data and Inputs to Produce Hydrogen
Given that the data appearing in official statistics are different from what appear in publications on global hydrogen market trends, the question is where are the data coming from? Hydrogen is presently used in the refining sector and to produce ammonia, methanol, and steel.[19] Global estimates published by entities such as the IEA and IHS Markit are found by back-calculating hydrogen demand from data on ammonia and methanol production as well as use of hydrogen in steel production and in refineries. Estimating the hydrogen consumed in refineries is a complex endeavor, as one needs to estimate the flows of oil that go through hydrotreatment and hydrocracking. As mentioned above, this can lead to different estimates.
While the demand side has been to some extent covered by these estimates, there is still a paucity of country-specific data for many nations. There is even less data on the production side for individual countries, in terms of fuel inputs. This is covered only by the IEA’s Global Hydrogen Review (for 2020) and by EIA data on natural gas’s use for hydrogen production in US refineries. Country-specific data on production are necessary to understand how hydrogen is produced as well as the carbon footprint of this production. This will become even more necessary in the future as the ways to produce hydrogen diversify, with an increasing amount of it being produced from solar, wind, biomass, and possibly nuclear or grid electricity as well as natural gas with carbon capture and storage.
It might take years to put in place better data collection and reporting approaches, even with institutions such as the IEA, Eurostat, the UN, and APEC already taking the first steps and starting discussions on how to include hydrogen in energy demand statistics. Statistical work is based on questionnaires sent by these institutions to member countries to collect various energy data,[20] and the process takes time, not only because countries need to establish the means of gathering and reporting these data, but also because the institutions need to determine which data categories they want to include on demand, production, and trade. According to these institutions, once data categories are chosen, countries could start to report data on hydrogen on a voluntary basis this year at the earliest and on a mandatory basis from 2024.[21]
Which Data to Collect
The fact that hydrogen is still at a relatively nascent stage requires some thinking about which data would be most useful, but it also offers the opportunity to build something robust. Given that some of these institutions have member countries in common, they are already in close contact and could ensure this new data collection is done uniformly. That includes deciding which hydrogen is to be considered so that the definitions are consistent across countries.
Besides, the hydrogen economy will go well beyond strictly hydrogen; it is already associated with hydrogen-related fuels such as ammonia and methanol. It is therefore likely that one would include ammonia and methanol in data collection when those compounds are used as energy vectors. There are already a lot of data on ammonia traded internationally, but only for its use as a fertilizer product, not as an energy product. It will be important to keep them separated because only the use of ammonia as an energy product should appear as a fuel in the energy balances.
Hydrogen, being an energy vector, has statistics on both the production side and the demand side, exactly like for electricity. On the production side, statistics should include the amount of primary fuels used (e.g., solar, wind, biomass, natural gas) and the carbon emissions associated with each. Statistics should also include data on production capacity (electrolyzer and methane reformers); this can be considered equivalent to monitoring the evolution of electricity capacity by fuel in the power generation sector.
On the demand side, statistics should include final consumption of hydrogen in buildings, industry, and transport as well as consumption in the transformation sector (e.g., power and refineries). To be comprehensive, the statistics should cover all hydrogen use, including the use of hydrogen in captive plants (such as the use of hydrogen to produce ammonia), even if that hydrogen does not appear outside of the facilities and may be difficult to effectively measure. The methodology to calculate these hydrogen quantities from the fossil fuel inputs must be fully disclosed. Understanding the quantities at stake will be crucial if countries are to reach their decarbonization goals because grey hydrogen produced mostly from fossil fuels will have to be replaced with low-carbon hydrogen, which in the future could be captive and produced on-site or potentially replaced by merchant hydrogen.
Unit and Convention Issues
This data-gathering process could also be an opportunity to standardize reporting on hydrogen by using energy units (joules or watt-hours) rather than weight or volumetric units such as kilograms (kg), cubic meters (m3), cubic feet (ft3), and thousands of barrels per day. This would build on an existing trend to move away from weight units, volumetric units, and energy units that are clearly linked to fossil fuels (such as million tons of oil equivalent [mtoe]): over the past two years, both the IEA and energy company bp have replaced mtoe units with EJ in their flagship publications. In a world that will be increasingly electrified, there is a case for harmonization by all players. This goes beyond the world of statistics to encompass all stakeholders to make sure everyone is speaking the same language.
Another reason to avoid volumetric units such as m3, ft3, or barrels is their need to be standardized and measured at the same pressure and temperature. Natural gas provides an example of statistical mismatches that can result from volumetric units: countries use different benchmarks, with consumption, production, and trade reported in a variety of units. Even when comparing bcm among them, they are measured at different temperatures and based on widely different calorific values, making comparison difficult.
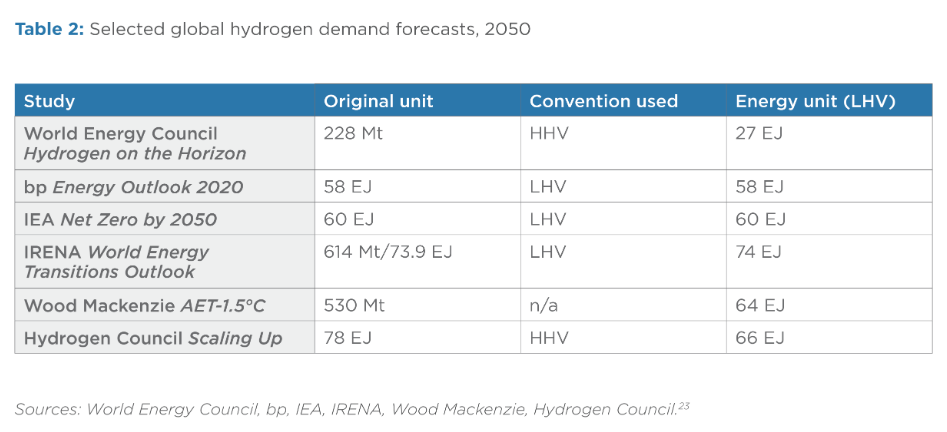
However, another issue arises when using energy units. The low heating value (LHV) of hydrogen is 120 megajoules (MJ) per kg (or 33.3 kilowatt-hours [kWh] per kg) and the high heating value (HHV) is 142 MJ per kg (or 39.4 kWh per kg).[22] There is an 18.3 percent difference between LHV and HHV when one converts to energy units (for pure hydrogen); it is therefore important to systematically specify which convention is being used to avoid confusion. Because there are two ways to report heating value, there might be some resistance to moving toward it and away from the weight unit—but using weight makes the comparison with other energies difficult. Additionally, the importance of the heating value should not be neglected, especially if hydrogen streams have different purities and therefore different heating values. A review of reports on hydrogen shows that both conventions (LHV and HHV) are being used today, which can lead to some confusion when such numbers are compared side by side (see Table 2).
Finally, another issue arises with hydrogen production capacity. Electrolyzer capacities are often expressed in terms of the electrical input. In contrast, the capacity of steam gas reforming represents the output in terms of hydrogen. This creates an issue when adding up hydrogen production capacity.
Recommendations
The world will need to undertake a significant transformation of its energy system if it is to achieve the goal of decarbonization. In order to understand and anticipate these changes and design the correct policies to meet them, policy makers need solid and robust data. The same applies to investors in various parts of the value chain. But with hydrogen and hydrogen-related fuels, official and comprehensive statistics have been relatively absent. As hydrogen’s potential is still emerging, there is a chance at this early stage to build an approach to data gathering that brings transparency to a key sector in decarbonizing the energy system. The following are possible steps toward that end:
- Countries could start working together to determine how best to collect hydrogen data, both on the demand and production sides, and include existing consumption as well as potential future consumption in new sectors. Statistics on the demand side need to anticipate new uses in buildings, industry, transport, and power, as well as account for hydrogen’s potential use to produce other energy products such as ammonia and methanol.
- Current grey hydrogen production will have to be displaced by low-carbon and renewable hydrogen to meet decarbonization goals, therefore visibility on how such clean hydrogen sources are replacing existing flows while meeting new needs will be paramount.
- Any country that expects to play a key role in the hydrogen economy from an early stage should be a role model in terms of having good statistics. A current state of play of a country’s hydrogen economy, including demand data by sector and production, could be included in all hydrogen strategies.
- The improvement of statistics could likely require more funding or personnel for statistical or energy offices; keeping sound data will need to be made a priority to justify this investment.
- The world needs to speak one language, and energy units appear to be a useful fit for hydrogen, as they enable a cross-fuel comparison. A mix of energy units, weight, and volumes are used today, so there would need to be an agreement toward harmonization from all stakeholders.
- All reports on hydrogen should make clear which convention is being used when expressing hydrogen quantities in energy units: LHV or HHV. The author would like to suggest low heating value be used because some statistical agencies are planning to use terajoule (LHV) for data collection.[24]
Originally published by Columbia | SIPA.
The statements, opinions and data contained in the content published in Global Gas Perspectives are solely those of the individual authors and contributors and not of the publisher and the editor(s) of Natural Gas World.
Notes
[2] European Commission, “A Hydrogen Strategy for a climate-neutral Europe,” July 8, 2020, https://ec.europa.eu/commission/presscorner/api/files/attachment/865942/... Department of Energy, “Hydrogen Shot,” June 7, 2021, https://www.energy.gov/eere/fuelcells/hydrogen-shot.
[3] International Energy Agency, World Energy Outlook 2021, October 2021, https://www.iea.org/reports/world-energy-outlook-2021.
[4] International Energy Agency, The Future of Hydrogen, July 2019, https://www.iea.org/reports/the-future-of-hydrogen.
[5] International Energy Agency, Global Hydrogen Review 2021, October 2021, https://www.iea.org/reports/global-hydrogen-review-2021.
[6] International Renewable Energy Agency, Geopolitics of the Energy Transformation: The Hydrogen Factor, January 2022, https://www.irena.org/-/media/Files/IRENA/Agency/Publication/2022/Jan/IRENA_Geopolitics_Hydrogen_2022.pdf.
[7] E. Connelly et al., ”DOE Hydrogen and Fuel Cells Program Record,” Department of Energy, October 1, 2019, https://www.hydrogen.energy.gov/pdfs/19002-hydrogen-market-domestic-global.pdf.
[8] According to the IEA’s Energy Statistics Manual, the “other hydrocarbons” category includes the production of products such as emulsified oils and synthetic crude oil from tar sands as well as shale oil, liquids produced from the coal liquefaction process, and hydrogen. International Energy Agency, Energy Statistics Manual, November 2004, https://iea.blob.core.windows.net/assets/67fb0049-ec99-470d-8412-1ed9201e576f/EnergyStatisticsManual.pdf.
[9] Ibid.
[10] Based on low heating value of hydrogen, 0.12 MJ per kg.
[11] Eurostat reports hydrogen in a database on manufactured goods, known as PRODCOM, under the product code 201111500.
[12] Eurostat, “Database on manufactured goods,” accessed in January 2022, https://ec.europa.eu/eurostat/web/prodcom/data/database.
[13] Fuel Cell and Hydrogen Observatory, “Hydrogen demand,” https://www.fchobservatory.eu/observatory/technology-and-market/hydrogen-demand.
[14] Energy Information Administration, “U.S. Refinery and Blender Net Input on Hydrogen,” accessed in January 2022, https://www.eia.gov/dnav/pet/hist/LeafHandler.ashx?n=pet&s=m_epoooh_yir_nus_mbbl&f=a.
[15] Energy Information Administration, “Natural Gas Used as Feedstock for Hydrogen Production at Refineries,” accessed in January 2022, https://www.eia.gov/dnav/pet/pet_pnp_feedng_k_a.htm.
[16] Statistics Canada, “Monthly Refined Petroleum Products Survey Reporting Instructions,” January 18, 2021, https://www.statcan.gc.ca/en/statistical-programs/document/2150_D3_V14.
[17] Energy Information Administration, “2018 Manufacturing Energy Consumption Survey,” November 2018, https://www.eia.gov/survey/form/eia_846/form_a.pdf.
[18] International Energy Agency, Global Hydrogen Review 2021, October 2021, https://www.iea.org/reports/global-hydrogen-review-2021; International Renewable Energy Agency, Geopolitics of the Energy Transformation: The Hydrogen Factor, January 2022, https://www.irena.org/-/media/Files/IRENA/Agency/Publication/2022/Jan/IRENA_Geopolitics_Hydrogen_2022.pdf; Fuel Cell and Hydrogen Observatory, “Hydrogen demand,” https://www.fchobservatory.eu/observatory/technology-and-market/hydrogen-demand; R. Mills and J. Friedmann, “The UAE’s role in the global hydrogen economy,” Qamar Energy, September 2021, https://www.qamarenergy.com/sites/default/files/The%20UAE%27s%20Role%20in%20the%20Global%20Hydrogen%20Economy.pdf.
[19] International Energy Agency, The Future of Hydrogen, July 2019, https://www.iea.org/reports/the-future-of-hydrogen.
[20] Eurostat, “Annual Questionnaire and Reporting Instructions,” https://ec.europa.eu/eurostat/web/energy/methodology/annual.
[21] Eurostat user support, correspondence with author, December 3, 2021.
[22] The main difference between these two values (HHV and LHV) is related to the state of the water resulting from the combustion process.
[23] World Energy Council, Hydrogen on the Horizon: Ready, Almost set, Go? July 2021, https://www.worldenergy.org/assets/downloads/Innovation_Insights_Briefing_-_Hydrogen_on_the_Horizon_-_Ready%2C_Almost_Set%2C_Go_-_July_2021.pdf; bp, Energy Outlook 2020, net-zero scenario, September 2020, https://www.bp.com/content/dam/bp/business-sites/en/global/corporate/pdfs/energy-economics/energy-outlook/bp-energy-outlook-2020.pdf; IEA, Net Zero by 2050, May 2021, https://www.iea.org/reports/net-zero-by-2050; IRENA, World Energy Transitions Outlook: 1.5°C Pathway, June 2021, https://irena.org/publications/2021/Jun/World-Energy-Transitions-Outlook; Wood Mackenzie, “Major energy exporters race to lead in global hydrogen trade,” October 28, 2021, www.woodmac.com/press-releases/major-energy-exporters-race-to-lead-in-global-hydrogen-trade; Hydrogen Council, Scaling Up, November 2017, https://hydrogencouncil.com/wp-content/uploads/2017/11/Hydrogen-scaling-up-Hydrogen-Council.pdf.
[24] Julian Prime of the IEA, in email correspondence with the author, December 6, 2021; Edito Barcelona of the Asia Pacific Energy Research Centre, in email correspondence with the author, December 16, 2021.