

Gazprom tops the gas producers' league
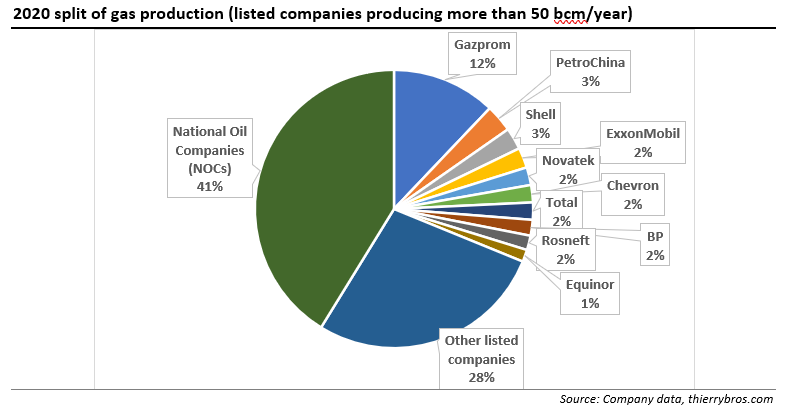
As major listed companies have published their full-year 2020 results[1] it is now possible to compare their gas output[2]. Gazprom stays the undisputed leader with a 12% worldwide market share followed, again this year, by PetroChina. And four partly state-owned Russian[3] and Chinese companies control 19% of worldwide gas production. Only three companies (Petrochina, Novatek and Chevron) managed to grow their gas production (by respectively 8%, 3.6% and 1.9%) in 2020 from 2019.
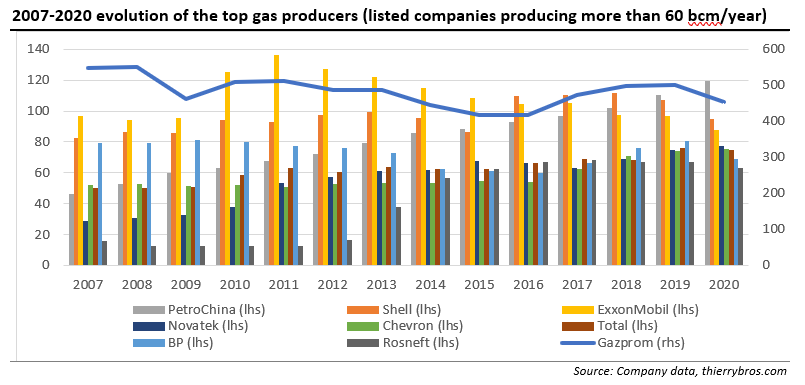
Even with a 9.5% drop in 2020, Gazprom stays the undisputed leader with 3.5 times more than its nearest rival. It is also the major provider of spare capacity (estimated[4] at 82bn m3 for 2020, which is more than the effective production of Novatek.
PetroChina, with its gas production focus, has overtaken respectively ExxonMobil in 2018 and Shell in 2019, to now sit firmly in second place. In a Covid-19 world, PetroChina recorded the highest full-year growth (+8%). With a 6.2% 2015-2020 organic compound annual growth rate (CAGR) PetroChina is second to Chevron (with CAGR over the last six years of 6.7%). PetroChina managed, in particular in 2020, to increase again its domestic production by an astonishing 9.9% (compared with only 4.8% for oil). PetroChina is increasing the intensity of its natural gas exploration and development at home to promote the growth of gas consumption. Its overseas gas production declined by 17.4%, accounting now for only 5.4% of its total production.
Anglo-Dutch major Shell saw gas production fall by 11.5%, mainly owing to the impact of more maintenance activities, hurricanes in the US Gulf of Mexico, divestments and lower production in the NAM joint venture with US ExxonMobil in the Netherlands (Groningen was down by 48.9% with more falls to come). LNG production was only down by 6.5% showing that LNG is less flexible than pipe gas.
ExxonMobil saw gas production grow with the purchase of US shale gas producer XTO in 2010. But since this acquisition, production has trended down, leaving ExxonMobil in fourth position. Last year again its gas production dropped by 9.8% compared with 1.6% for its oil.
With another 3.6% growth in gas production thanks to the end of Yamal LNG ramp-up, Novatek moves up two ranks to fifth..
Chevron’s growth (1.9%) is largely due to the Noble Energy acquisition, partly offset by production curtailments. As the merger was completed in October 2020 it only impacted positively Q4 2020 production data. We should expect further growth in 2021. It is interesting to note that in the past few years, Chevron is the company that managed to effectively grow the most its gas production with a 2015-2020 CAGR of 6.7%.
French Total produced 1.6% less gas while its oil production was down by 4.7%. With this drop, Total moves down one rank to seventh.
With a massive drop (-15.1%) in gas production, BP[5] moves back from fifth to eighth place. It is interesting to note that this drop is much more in gas than oil (-4.6%), showing that gas production is much more flexible and allows unexpected demand declines to be balanced much faster. The overall drop (-9.9%) in hydrocarbon production is mainly due to the impact of divestments in the US, reduced capital investment levels and decline, and significant weather impacts from hurricanes in the US Gulf of Mexico.
Russian Rosneft and Norway's Equinor both witnessed production decline of respectively 6.2% and 2.2% and remain at the end of the ranking. In five years. Rosneft's gas production has gone up five times.
With a drop of 10.6%, Eni produced only 48bn m3 in 2020 and is therefore removed from this graph.
We should expect a rebound in gas production across the board in 2021. But natural field decline and lower capex (effectively spent in 2020 and the expected restraint in 2021) should make it difficult to recover quickly the 2019 output levels.
Since 2019, Gazprom has been not the only producer with de-facto spare capacity. The forced shut ins and extended maintenance in 2020 resulted in a record high worldwide spare capacity. Now, natural decline and lower capex should fast erode this… The boom-and-bust cycle will continue during this energy transition decade.
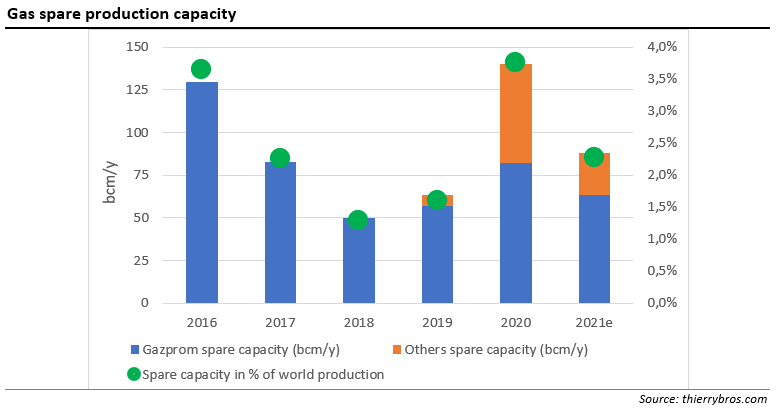
While accounting for 59% of the 2020 worldwide gas spare capacity, Gazprom had to idle 20% of its own capacity. In aggregate, the second provider of global spare capacity is the US (18%) where 28% of its LNG capacity had to be shut in. Despite not being the biggest LNG exporter, the US (with a few companies) and Russia/Gazprom share the ultimate ability to balance global gas markets…
Back in 2012, in my first book After the US shale gas revolution, I correctly forecast that the surge in US oil and gas production, combined with the European energy transition (the bloc set its 20-20-20 targets in 2008) would deeply alter the energy and geopolitical landscapes. The US and Russia have the ultimate say on prices by de facto collaboration (adjusting supply) or confrontation (oversupply)... Not sure this new dynamic is well understood in Brussels!
Thierry Bros
March 29, 2021
Advisory Board Member, Natural Gas World
[1] PetroChina on 25 March 2021; Gazprom financial results are not out but production results are available at https://www.gazprom.com/press/news/2021/march/article525623/
[2] Not all companies provide the exact same units for their reporting; the data here are as “raw” as possible vs those provided directly by the companies.
[3] On 28 March 2020, Rosneft’s capital structure changed with Rosneft receiving a 9.6% share of its own equity capital owned formerly by the State. This participation is now held by a 100% subsidiary of Rosneft (LLC RN-NeftKapitalInvest). According to the Russian law, those shares are considered as quasi-treasury and preserve voting rights as well as receive dividend. https://www.rosneft.com/press/releases/item/200275/
[4] By taking its maximum daily production and comparing it to its annual production
[5] Excluding its Rosneft share.