


Fuelling the world [NGW Magazine]
The US Energy Information Administration (EIA) published its 2019 edition of International Energy Outlook (IEO2019) in September, which gives energy projections out to 2050. This article looks at the ‘Reference Case’, which assumes that: world GDP grows by a compound annual rate of 3% in 2018-2050; the population grows by about 2bn; and the Brent crude oil price in 2050 is $100/barrel, in 2018 terms.
These projections are based on “current policies, expected regional economic and population growth across the world, planned changes to infrastructure and assumed incremental cost and performance improvements in known technologies based on historical trends.” But they do not account for changes to current policies, future technological breakthroughs and major disruptive geopolitical or economic events – that is why these are projections and not forecasts. These projections are also useful in providing a baseline for estimating the effects of future policy and technology changes.
The key takeaways from IEO2019 are that by 2050:
- World primary energy consumption grows by close to 50% over the projection period, driven by China and India.
- Renewable energy grows rapidly, providing almost half of world electricity generation, and becoming the leading source of world primary energy, with a 27% share.
- Demand for fossil fuels grows by about a quarter but their share of primary energy declines to almost 70%, in comparison to 81% in 2018.
- Oil demand continues to grow, with total petroleum liquids production reaching about 127mn b/day, from about 100mn b/day in 2018.
- Natural gas demand grows substantially, by over 40% over the projection period, increasing by 1.1%/yr.
- Natural gas and petroleum product consumption is rising in Asia faster than supply is growing, potentially shifting global trade patterns and infrastructure investments.
- Coal demand continues to grow in real terms, by about 16% over the projection period, led by India, but its share of world primary energy drops to less than 20%.
- The industrial sector is the largest consumer of energy, accounting for more than half global end-use energy, led by non-OECD countries.
- Electricity generation sees the fastest growth in terms of end-use energy sources, increasing by 79% over the projection period, and providing 22% of total end-use energy.
- The number of electric vehicles (EVs) rises to more than 430mn, out of a total 2.4bn light vehicles worldwide.
- Energy-related carbon emissions are projected to carry on growing, on average by 0.6%/yr.
- Energy and carbon emission intensities continue to decline in both OECD and non-OECD countries because of efficiency gains and moving away from coal to renewables and natural gas.
But despite the continuous decline in energy and carbon emission intensities, without change, the projections in IEO2019 indicate that global warming will exceed the 2 C Paris Agreement target.
World energy consumption
World primary energy consumption grows by close to half over the projection period (Figure 1). Most of the growth comes from non-OECD countries, almost 70%, driven by strong economic growth and increasing populations in China and India. The growth in OECD countries is modest, projected to be about 15%.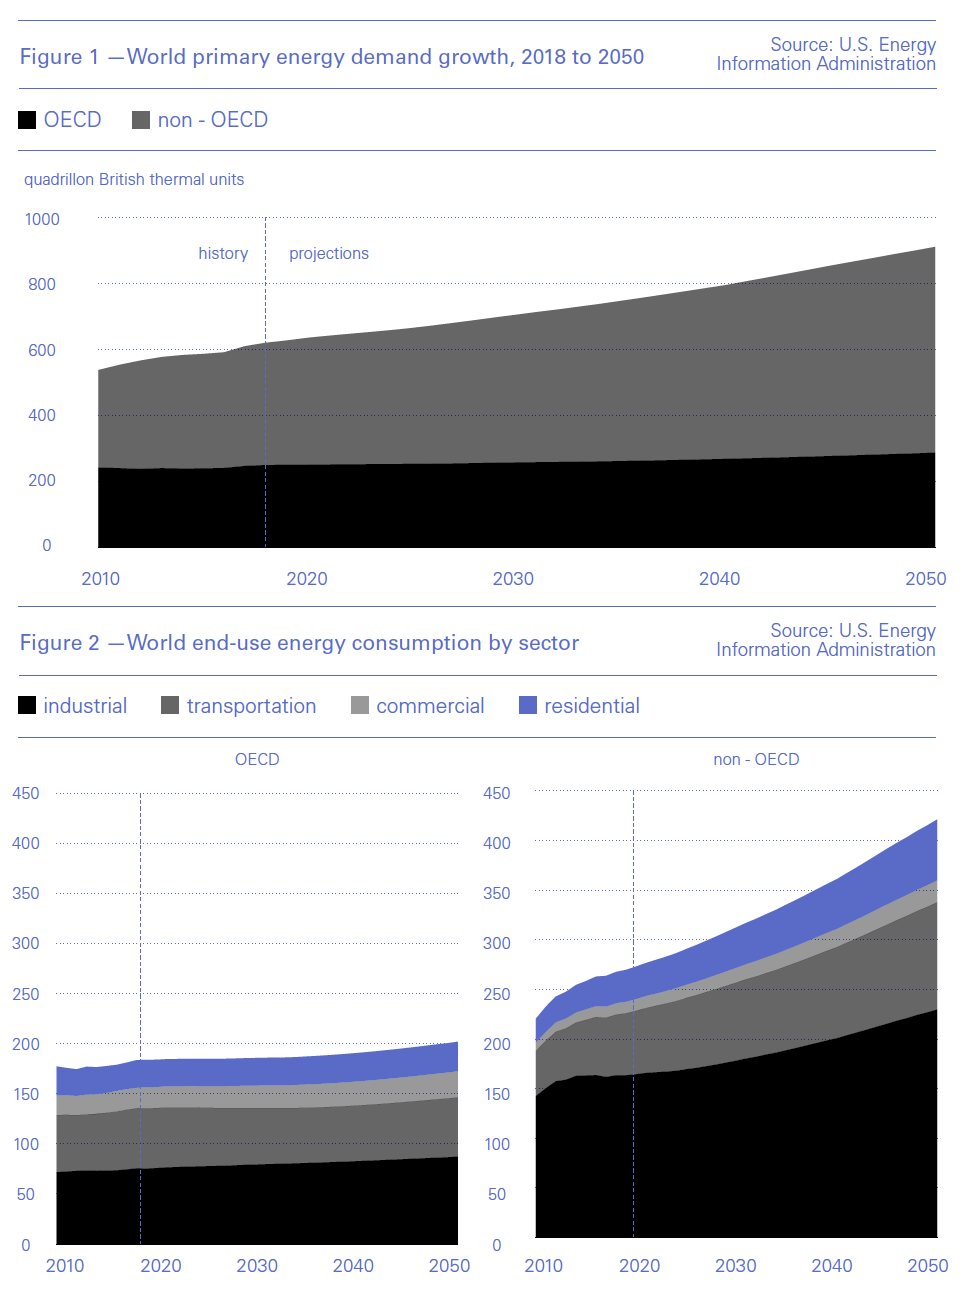
Commenting on this, Linda Capuano, EIA Administrator, said: “We project that consumption will almost double between 2018 and 2050, making Asia both the largest and fastest-growing region in the world for energy consumption…. This long-term trend of Asian energy consumption to support growing economies strongly influences the extraction, refining, and transport of oil, natural gas, and other fuels.”
Growth in energy consumption in non-OECD countries, is the result of strong economic growth, increased access to marketed energy, and rapid population growth.
The industrial sector is the largest consumer of energy, accounting for more than 50% of world end-use energy consumption by 2050 (Figure 2) – or 35% of world primary energy. End-use fuels include fuels consumed in the industrial, transportation and buildings sectors and exclude fuels used for electric power generation.
Again, most of the increase is in non-OECD countries, growing by more than 1%/yr, in comparison to about 0.5%/yr in OECD countries. China remains the world’s largest single industrial energy consumer, but India experiences the most growth in consumption – with manufacturing centres shifting towards south Asia, especially to India, where industrial growth and demand for motorised transportation will power ahead.
Even by 2050 fossil fuels meet about three quarters of industrial sector demand -- because of energy density, cost competitiveness, and chemical properties -- with the rest provided by electricity and renewables. This is much the same as in 2018.
Primary energy consumption grows for all fuels, including coal (Figure 3), with renewables becoming the leading source by 2050, with a 27% share.
But fossil fuels still provide about 70% by 2050 – down from about 81% in 2018 -- with natural gas becoming the fastest-growing fossil fuel.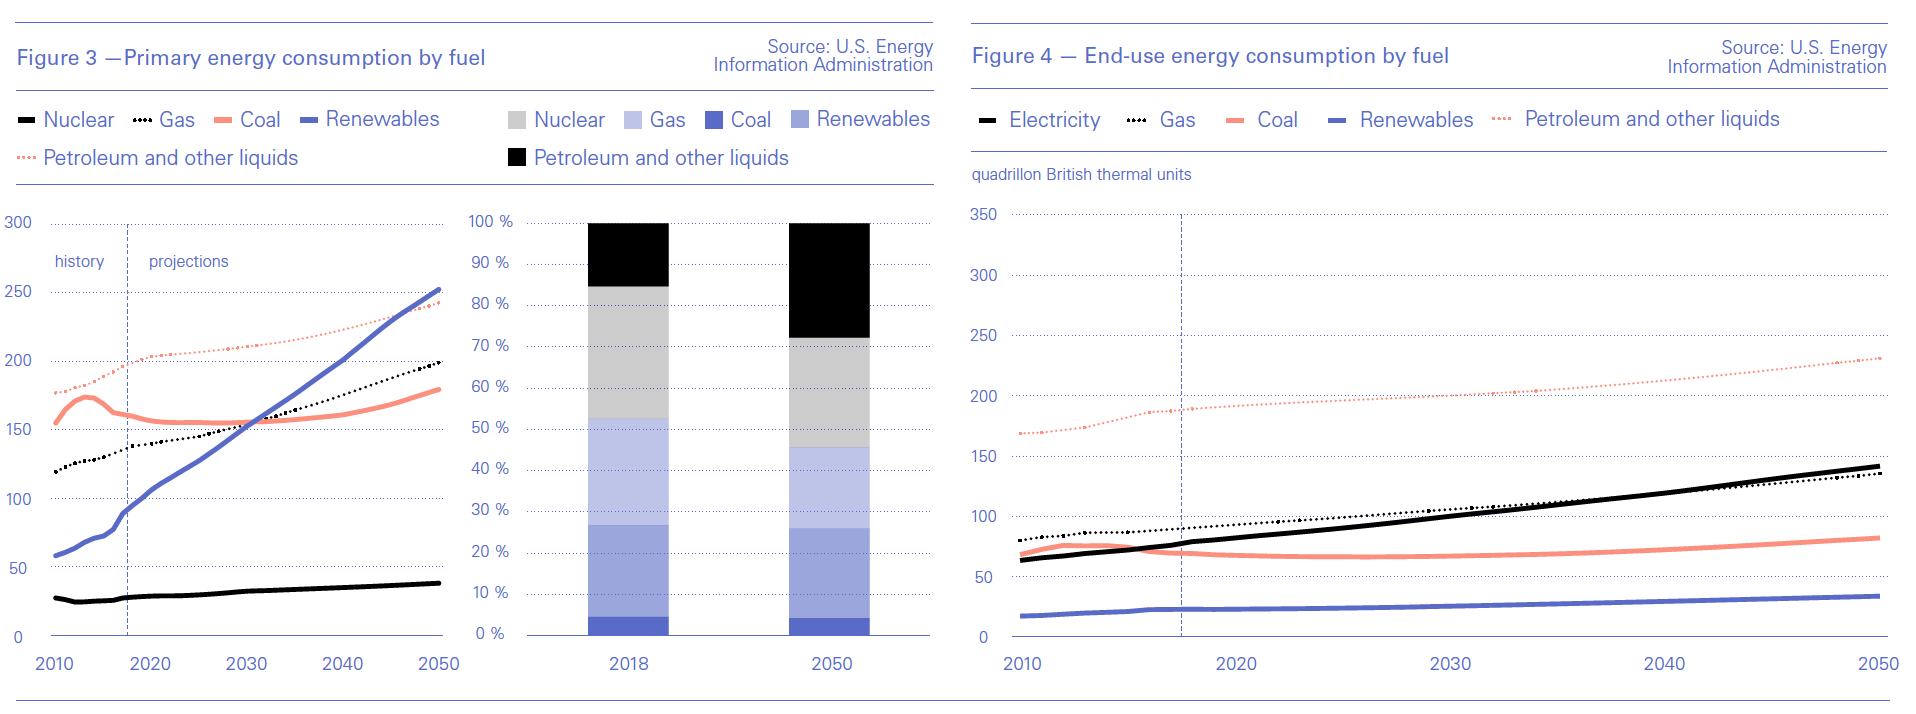
Oil demand continues to grow, with total petroleum liquids production reaching about 127mn b/day, from about 100mn b/day in 2018. Production from large, low-cost, oil resources in the Middle East – especially after 2030 -- remains a critical part of global crude oil supply during the projection period.
When it comes to end-use, composition shifts increasingly towards electricity (Figure 4), driven by falling generation costs, with electricity generation seeing the fastest growth, increasing by 79% between 2018 and 2050, and providing about 22% of end-use energy. 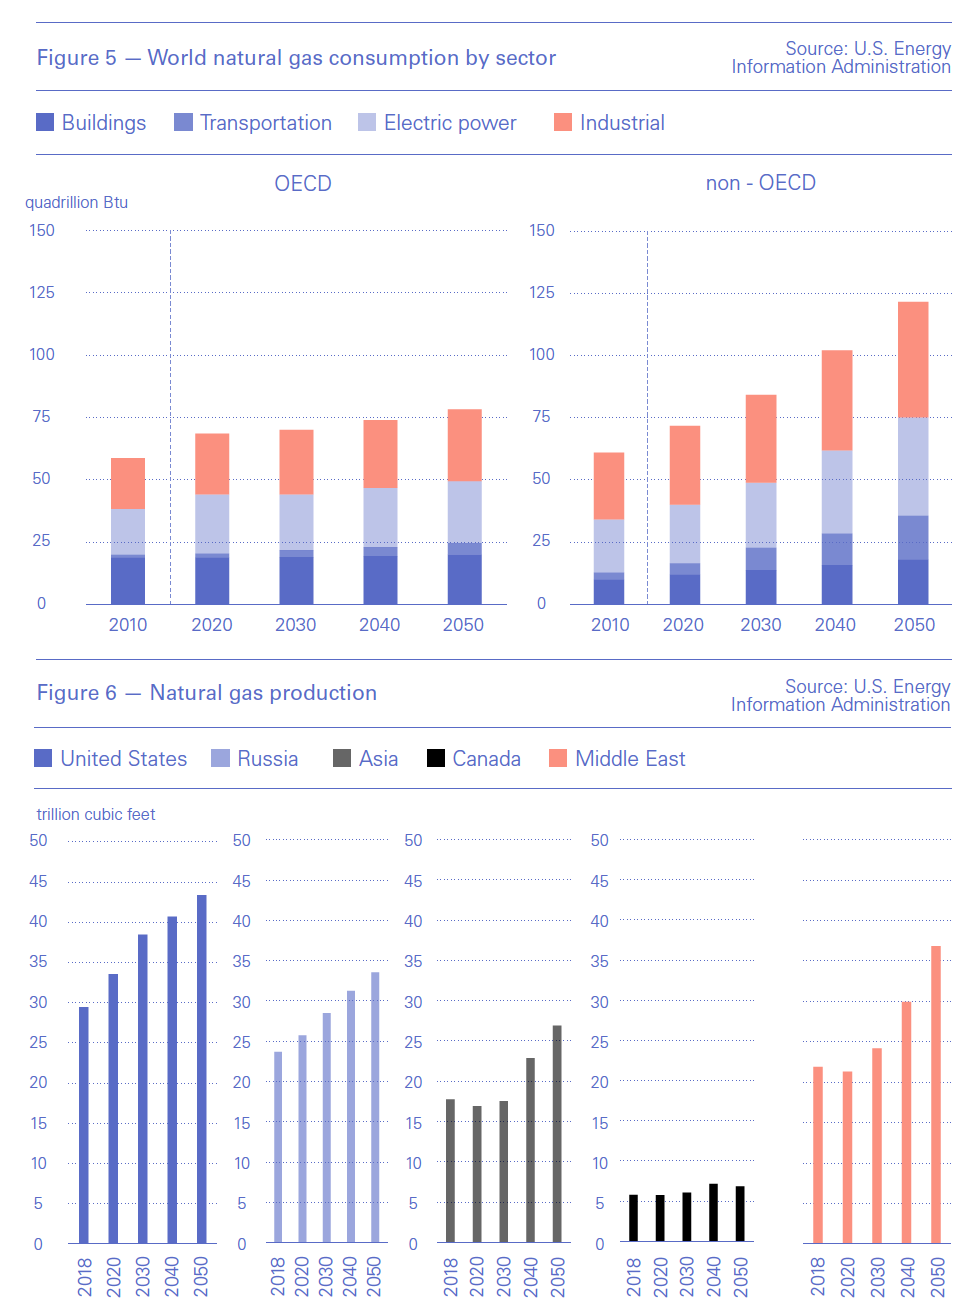
Its use in the residential and commercial building sectors increases rapidly because of growing income and population and wider access to electricity in non-OECD regions. Increasing EV numbers also contributes to this growth.
Natural gas consumption and production
Natural gas consumption grows substantially, by over 40% over the projection period (Figure 5), increasing by 1.1%/yr.
Most of the growth is in non-OECD countries to meet demand from increased industrial activity, natural gas-fired electricity generation, and transportation fueled by LNG.
Despite the rapid growth in renewable energy, natural gas consumption for electricity generation in non-OECD countries increases more than 60%, at 1.5%/yr, to meet the rapid increase in electricity demand in those countries. In OECD countries, growth in natural gas demand in the power sector is much lower, at 0.3%/yr.
China’s use of natural gas is expected to go up by nearly 190% from 2018 to 2050, reaching 21.7 tn ft3 in 2050, while India’s rises even faster, more than 250%, to reach 7.0 tn ft3 in 2050. But given the impact of trade wars and rapidly changing global energy trading patterns, this remains to be seen.
This increased demand is met mostly by natural gas production in the Middle East, the US, Russia, and non-OECD Asia (Figure 6).
The US remains the world’s largest natural gas producer throughout the projection period, reaching 43 tn ft3 in 2050, nearly 50% up on 2018. It also grows as a net exporter of natural gas, driven mostly by LNG exports.
Natural gas production in Russia increases by about 40%, reaching 34.0 tn ft3 in 2050, with most of the increase exported to Asia and Europe. Middle East production overtakes that from Russia by 2050, reaching 37 tn ft3 in 2050, about a 70% increase from 2018.
Interestingly, the EIA says that despite strong growth in LNG trade, pipeline flows continue to account for most of the inter-regional natural gas trade during the projection period as pipeline infrastructure is developed further. Over the projection period, OECD Europe increases its dependence on Russian pipeline natural gas, while non-OECD Asia imports a growing amount of LNG.
Renewable energy
Renewable energy – including solar, wind, hydro, geothermal, and other -- grows rapidly, providing most of the growth in electricity generation (Figure 7). By 2050 renewables share of global electricity generation increases to almost 50%. Natural gas and coal provide just over 20% each, with nuclear providing the rest. 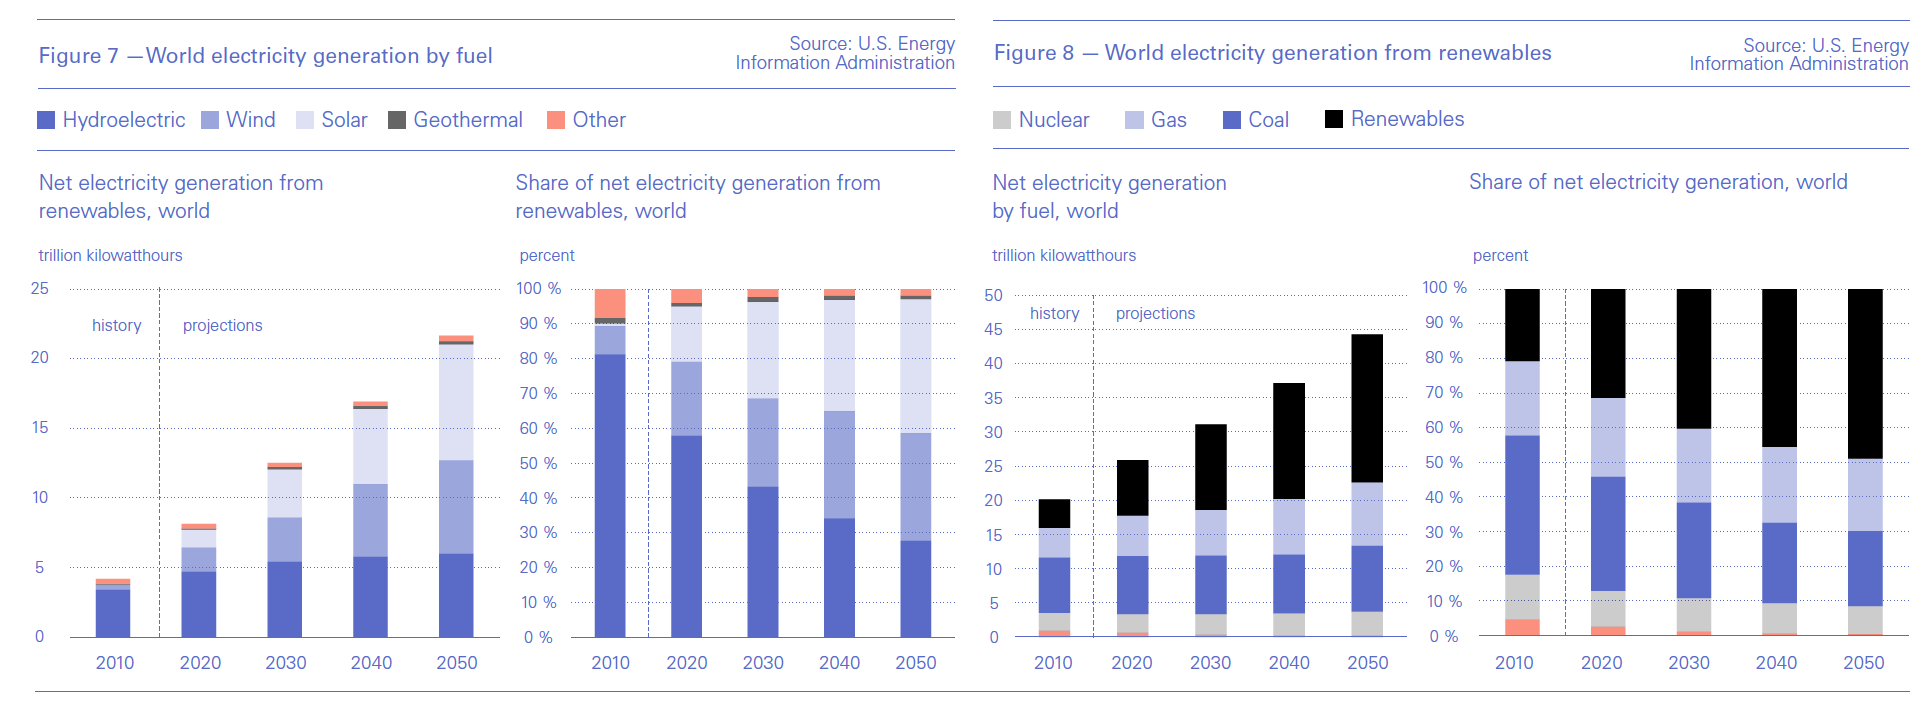
Wind and solar dominate the growth in renewable electricity generation (Figure 8), with their share exceeding 70% by 2050. Both China’s and India’s rapidly growing electricity demand is met primarily with renewable energy, with 55% and 58% respectively by 2050.
China is projected to see the most growth in solar power generation because of its growing demand for electricity, favourable government policies, and competitive technology costs.
EIA states that although renewables increase rapidly and are cost-competitive compared with new fossil-fired electric generating capacity additions, displacing existing non-renewable capacity requires further policy incentives.
Carbon emissions
Despite the rapid growth in renewables, energy-related carbon emissions are projected to carry on growing, on average by 0.6%/yr – substantially lower than the 1.8% rate experienced in the period 1990 to 2018. Growth accelerates during the second half of the projection period (Figure 9) due to non-OECD country population and economic growth. In OECD countries energy-related carbon emissions decline, but only slightly, by about 0.2%/yr. By 2050 over 70% of energy-related carbon emissions will be produced by non-OECD countries.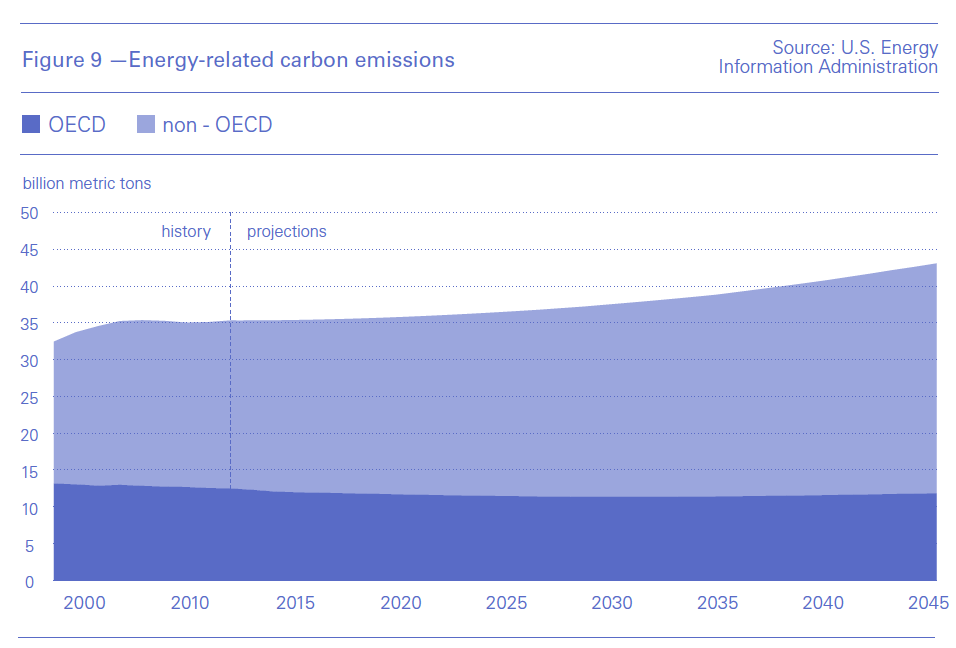
But this masks the fact that on a per capita basis, OECD countries emit far more energy-related CO2 than non-OECD countries. By 2050, OECD countries emit 8.2 tons per person compared with 3.8 tons per person in non-OECD countries.
Overall, the increase in energy-related carbon emissions between 2018 and 2050 is projected to be about 22%.
Even though most carbon emissions are the result of coal and petroleum liquids consumption, natural gas still contributes about 25% reflecting its rapidly increasing share of world energy consumption. This is why gas is also attracting attention in the fight against climate change.
On the positive side, energy and carbon emission intensities continue to decline in both OECD and non-OECD countries because of efficiency gains and moving away from coal to renewables and natural gas – with world energy intensity improving at a rate of 1.7%/yr.
But without change, by 2050 non-OECD countries will be about as carbon intensive as OECD countries are today.
Implications
The significance of EIA’s world energy projections to 2050 lies in the fact that they are based on current policies. In other words, without policy change this may be the direction in which world energy and global energy-related carbon emissions are going, with global warming certain to exceed the 2degC Paris Agreement target.
But as the EIA says, “energy market projections are uncertain because the events that shape future developments in technology, demographic changes, economic trends, and resource availability that drive energy use are fluid.”
This is convincingly reflected by the wide range of projections and forecasts of global primary energy consumption in recently published comparisons (Figure 10). Out of the 18 scenarios, only two expect the level of global primary energy consumption to be lower by 2040 in comparison to 2017. Leaving BP’s 2019 ‘more energy’ outlier scenario out, the rest expect this to grow between 10% and 40%, with an average of about 25% - close to IEA’s ‘new policies’ and BP’s ‘evolving transition’ scenario.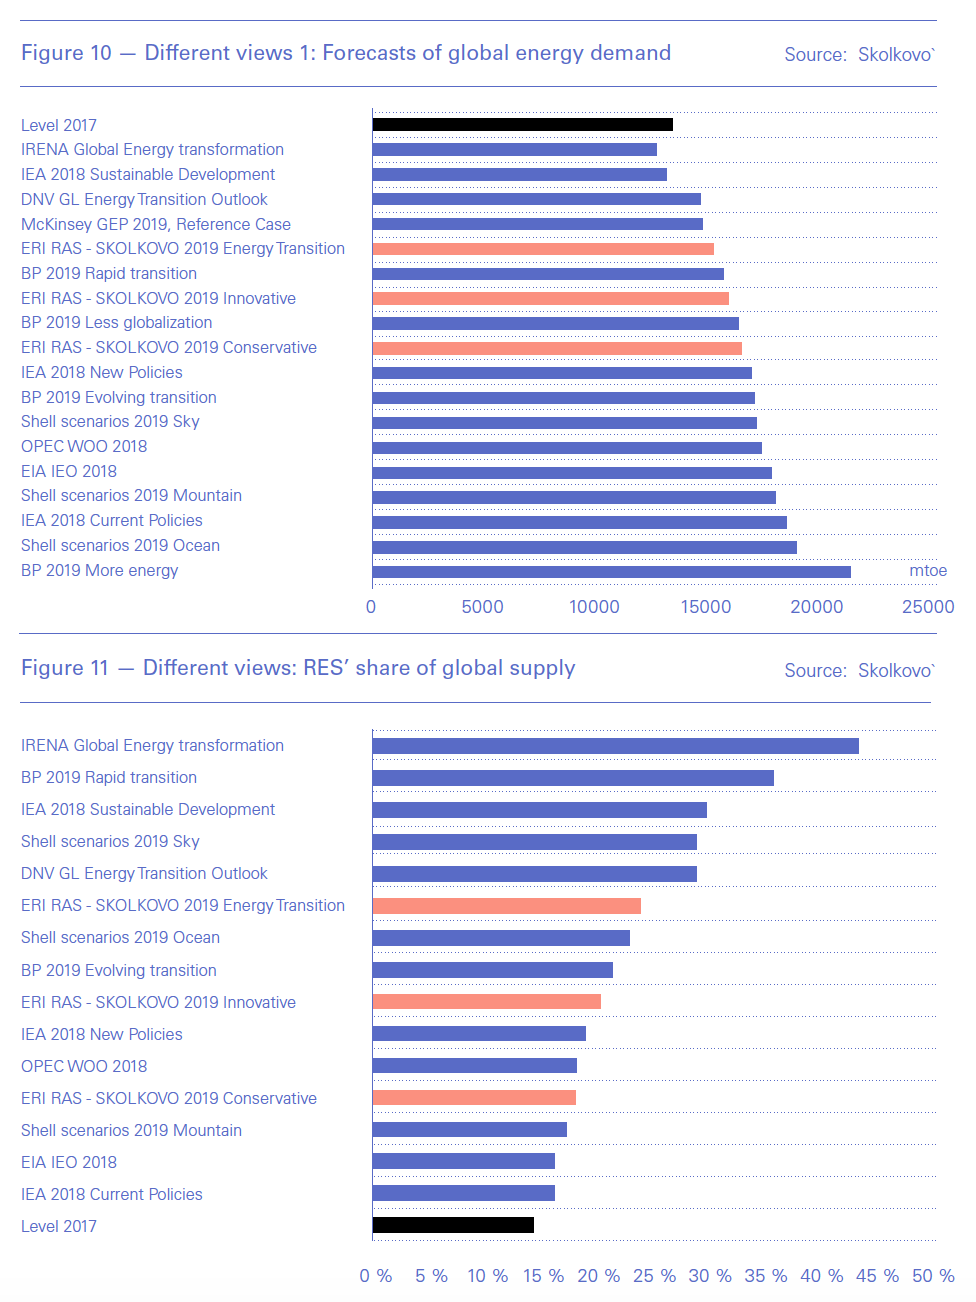
The spread is even wider when it comes to projections and forecasts of the share of renewable energy in global energy consumption (Figure 11).
The uncertainties in terms of the impact of technological advancements on the progress of renewable energy are vividly shown in Figure 11, ranging from 15% to 45% of global energy by 2040 in comparison to 2017. The average is 25%, close to Shell’s 2019 ‘ocean’ scenario.
All five scenarios that project a renewable energy share greater than 30% require step-changes in energy efficiency and the way the world produces and consumes energy, as well as huge changes in people’s lifestyles and mindset in the way they use energy.
It is the latter that is often overlooked. Most people understand the need for, and support, tackling climate change, but only as long as it does not affect their lifestyles. This is even more so in Asia where most of the increase in primary energy demand is expected to take place between now and 2050, as a result of population growth and the desire to escape poverty and improve living standards. Inevitably this pushes up carbon emissions.
Even though environmental concerns and climate activism are growing fast in OECD countries, that is not necessarily the case in non-OECD countries where energy affordability and improving living standards take priority. Figures 1 and 9 demonstrate the conundrum. By 2050 almost 70% of world energy will be consumed in non-OECD countries, which will also produce more than 70% of the world’s energy-related carbon emissions. As a result, taking drastic action to curb carbon emissions in OECD countries alone may have limited effect.
It is due to these energy market projection uncertainties that the energy sector sees it as its obligation to ensure sufficient energy supplies are available while the world decides how to tackle energy transition and governments introduce appropriate policies to achieve that. In the meanwhile, IEO2019 and other forecasts compared in Figure 10 show that the world still requires oil and gas during energy transition, meaning that there is a responsibility to carry on producing.
The overall conclusion that can be drawn from IEO2019 is that in terms of climate change carrying on without change is unsustainable. In the longer-term technological breakthroughs may help deal with this, but the urgency now is for governments, not just the energy industry, to take the lead with appropriate policies to contain global warming.